
Using Moving Averages for Forex Trading
Moving averages (MAs) are essential tools for traders, providing a smoothed view of historical price data. They are calculated by averaging the closing prices of a currency pair over a specified period. This averaging process helps to filter out market noise and highlight the underlying trend. Imagine the market as a choppy sea; moving averages are like a steady boat, guiding you through the waves by showing you the overall direction.
The primary purpose of a moving average is to give a clearer picture of price trends. By smoothing out price fluctuations, MAs help traders focus on the broader market direction rather than getting caught up in short-term volatility. This is akin to focusing on the long-term weather patterns rather than daily weather changes, helping traders make more informed decisions based on overall trends rather than momentary fluctuations.
One key aspect of moving averages is that they lag behind the current price because they are based on historical data. This lag can be both an advantage and a disadvantage. On one hand, it provides a more stable view of the market. On the other hand, it means that moving averages may not respond quickly to sudden price changes. Traders must balance the benefits of smooth trend indicators with the need for timely decision-making.
Contents
Types of Moving Averages
There are several types of moving averages, each with its distinct characteristics and applications in forex trading. The most commonly used types are:
- Simple Moving Average (SMA): The SMA is calculated by taking the arithmetic mean of a specified number of closing prices. For instance, a 10-day SMA is the average of the last ten closing prices. It’s the most basic form of moving average, and its simplicity makes it easy to understand and use.
- Exponential Moving Average (EMA): Unlike the SMA, the EMA gives more weight to recent prices, making it more responsive to recent price changes. This means that the EMA reacts faster to new information compared to the SMA. The weighting factor in the EMA calculation helps it capture recent market movements more effectively.
- Weighted Moving Average (WMA): The WMA assigns different weights to different prices, with more recent prices typically receiving more weight. This approach allows the WMA to be more responsive to recent price changes while still considering historical data.
Each type of moving average has its strengths and weaknesses. The SMA is straightforward and easy to calculate but may lag significantly during volatile periods. The EMA and WMA offer more responsiveness but can be more complex to compute. Choosing the right type depends on your trading style and objectives.
Why Use Moving Averages in Forex Trading?
Moving averages are used extensively in forex trading for several reasons:
- Trend Identification: Moving averages help traders identify the overall direction of the market. By smoothing out price data, they reveal whether the market is in an uptrend, downtrend, or sideways movement. This insight is crucial for making informed trading decisions and aligning trades with the prevailing market direction.
- Support and Resistance Levels: Moving averages can act as dynamic support and resistance levels. When the price is above a moving average, the MA can serve as support, and when the price is below it, the MA can act as resistance. These levels can provide useful points for placing stop-loss orders or determining potential entry and exit points.
- Signal Generation: Crossovers between different moving averages, such as the SMA or EMA, generate trading signals. For example, a crossover of a short-term MA above a long-term MA might signal a buying opportunity, while a crossover below could signal a selling opportunity. These signals help traders make timely decisions based on changes in market momentum.
Understanding the role of moving averages in trading can significantly enhance your trading strategy. Whether you’re identifying trends, spotting support and resistance, or generating trading signals, moving averages offer valuable insights that can help improve your trading outcomes.
Simple Moving Average (SMA) Strategies
Understanding SMA
The Simple Moving Average (SMA) is one of the most fundamental tools in forex trading. It is calculated by averaging the closing prices of a currency pair over a specific number of periods. For example, a 20-day SMA adds up the closing prices for the last 20 days and divides by 20. This provides a smoothed line on the price chart, which helps traders see the general direction of the market.
The SMA’s primary strength lies in its simplicity and ease of calculation. It is a straightforward way to analyze price trends without complex computations. However, its simplicity also means that it can lag behind the price, especially during periods of high volatility. This lag can sometimes lead to delayed trading signals, which may impact trading performance.
Despite its limitations, the SMA remains a popular choice due to its clear and easy-to-understand nature. Traders often use the SMA to confirm trends and identify potential buy or sell signals. Its straightforward calculation and visualization make it a valuable tool for both novice and experienced traders.
Common SMA Periods
Different SMA periods are used for various trading objectives, and each period offers unique insights into market behavior:
- Short-Term SMA (e.g., 10-day): This period is useful for identifying short-term trends and potential reversals. A short-term SMA reacts quickly to recent price changes, making it suitable for traders who focus on shorter timeframes and need to capture quick market moves.
- Medium-Term SMA (e.g., 50-day): A medium-term SMA helps traders gauge the intermediate trend and provides a balance between short-term and long-term perspectives. It smooths out daily fluctuations while still being responsive to changes in the market.
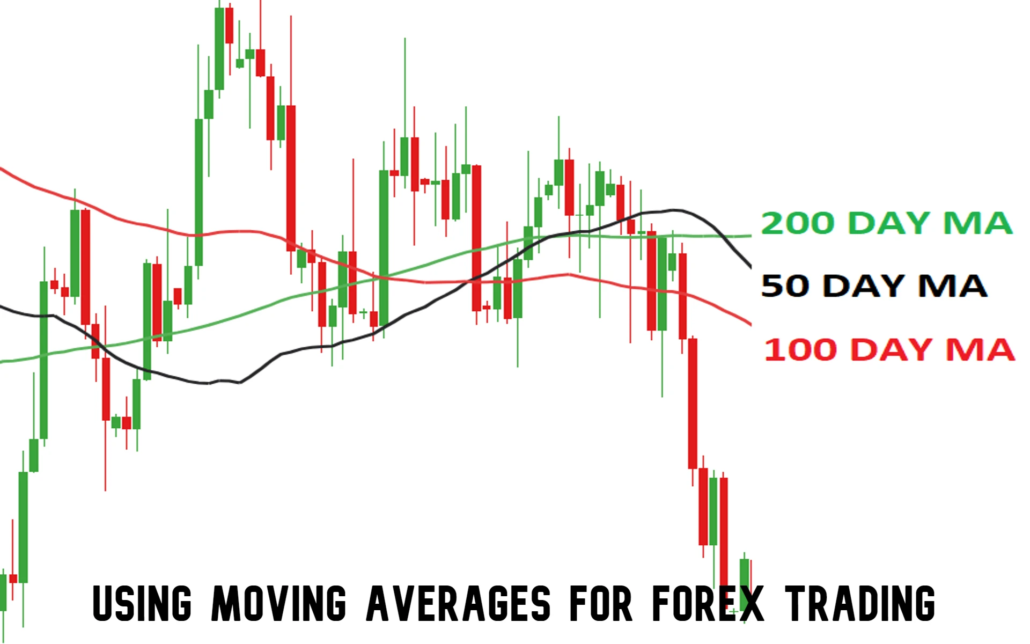
- Long-Term SMA (e.g., 100-day and 200-day): Long-term SMAs are used to understand the broader market trend. They provide insights into the overall direction of the market and help traders align their trades with long-term trends. These SMAs are often used in conjunction with shorter-term SMAs to confirm long-term trends and identify potential trend reversals.
Choosing the right SMA period depends on your trading style and objectives. Short-term SMAs are better suited for day traders, while medium- and long-term SMAs are more appropriate for swing traders and long-term investors.
SMA Crossover Strategy
The SMA crossover strategy is a popular trading approach that uses the crossing of two SMAs to generate buy and sell signals:
- Setup: Plot two SMAs on your chart, typically a short-term SMA (e.g., 10-day) and a long-term SMA (e.g., 50-day). The short-term SMA will react more quickly to price changes, while the long-term SMA will provide a smoother trend line.
- Buy Signal: A buy signal occurs when the short-term SMA crosses above the long-term SMA. This crossover indicates that the short-term trend is gaining momentum and suggests a potential upward move in the market. Traders often look for additional confirmation, such as a break above a resistance level, before entering a trade.
- Sell Signal: Conversely, a sell signal is generated when the short-term SMA crosses below the long-term SMA. This crossover indicates that the short-term trend is weakening and suggests a potential downward move. Traders may consider exiting long positions or entering short positions based on this signal.
- Stop-Loss and Take-Profit: To manage risk, traders should place stop-loss orders below recent swing lows for buy trades and above recent swing highs for sell trades. Additionally, setting take-profit levels based on risk-reward ratios can help lock in profits and protect gains.
The SMA crossover strategy is simple yet effective, making it a popular choice among traders. However, it’s important to combine it with other technical indicators and analysis techniques to increase its accuracy and reliability.
Exponential Moving Average (EMA) Strategies
Understanding EMA
The Exponential Moving Average (EMA) is a more sophisticated moving average that gives greater weight to recent prices. This weighting makes the EMA more responsive to recent price changes compared to the SMA. For example, a 20-day EMA places more importance on the most recent 20 days of price data, allowing it to react more quickly to market movements.
The EMA is particularly useful in volatile markets where rapid price changes occur. Its responsiveness helps traders capture short-term trends and potential reversals more effectively than the SMA. However, this increased sensitivity can also lead to false signals during periods of market noise or low liquidity.
Traders often use the EMA to identify trends, generate trading signals, and confirm other technical indicators. Its responsiveness and ability to filter out noise make it a valuable tool for both trend-following and momentum-based strategies.
Common EMA Periods
Similar to the SMA, the EMA can be customized to different periods based on trading objectives:
- Short-Term EMA (e.g., 5-day and 20-day): Short-term EMAs are useful for identifying rapid price changes and short-term trends. They react quickly to recent price movements, making them ideal for day traders and scalpers who need to capture fast market moves.
- Medium-Term EMA (e.g., 50-day): A medium-term EMA provides a balance between responsiveness and smoothness. It helps traders identify intermediate trends and potential trend reversals while filtering out some of the market noise present in shorter-term EMAs.
- Long-Term EMA (e.g., 100-day and 200-day): Long-term EMAs are used to analyze the broader market trend. They provide insights into the overall direction and help traders align their trades with long-term market movements. These EMAs are often used in conjunction with shorter-term EMAs to confirm trends and identify potential reversals.
Choosing the appropriate EMA period depends on your trading style and objectives. Short-term EMAs are suited for active traders, while medium- and long-term EMAs are more appropriate for those focusing on longer-term trends.
EMA Crossover Strategy
The EMA crossover strategy is a popular technique that uses the crossing of two EMAs to generate trading signals:
- Setup: Plot two EMAs on your chart, typically a short-term EMA (e.g., 5-day) and a long-term EMA (e.g., 20-day). The short-term EMA will be more responsive to recent price changes, while the long-term EMA will provide a smoother trend line.
- Buy Signal: A buy signal is generated when the short-term EMA crosses above the long-term EMA. This crossover suggests that the short-term trend is gaining momentum and indicates a potential upward move in the market. Traders often look for additional confirmation, such as a break above a resistance level, before entering a trade.
- Sell Signal: Conversely, a sell signal occurs when the short-term EMA crosses below the long-term EMA. This crossover indicates that the short-term trend is weakening and suggests a potential downward move. Traders may consider exiting long positions or entering short positions based on this signal.
- Stop-Loss and Take-Profit: To manage risk, traders should place stop-loss orders below recent swing lows for buy trades and above recent swing highs for sell trades. Additionally, setting take-profit levels based on risk-reward ratios can help lock in profits and protect gains.
The EMA crossover strategy offers a more responsive approach compared to the SMA crossover strategy. However, it is important to use it in conjunction with other technical indicators and analysis techniques to enhance its accuracy and reliability.
Advanced Moving Average Strategies
Moving Average Envelopes
Understanding Moving Average Envelopes
Moving average envelopes are bands placed above and below a moving average. The distance between the bands is typically expressed as a percentage of the moving average value. For example, if the moving average is 100 and the envelope is set at 2%, the bands would be at 98 and 102. This approach helps traders identify potential overbought and oversold conditions.
Envelopes are particularly useful in identifying price extremes and potential reversal points. When the price approaches the upper band, it may be considered overbought, while approaching the lower band may indicate oversold conditions. This information can help traders identify potential entry and exit points based on market conditions.
One key advantage of using moving average envelopes is their ability to adapt to different market conditions. By adjusting the envelope percentage, traders can customize the bands to fit various levels of volatility. This flexibility allows traders to tailor the strategy to different currency pairs and trading environments.
Setting Up Moving Average Envelopes
- Select a Moving Average: Choose a moving average (SMA, EMA, etc.) as the basis for the envelopes. The choice of moving average will depend on your trading objectives and preferences.
- Determine Envelope Percentage: Set the envelope percentage based on the desired distance from the moving average. For example, a 2% envelope would place the bands 2% above and below the moving average.
- Plot Envelopes: Plot the envelopes on your chart, with bands above and below the moving average. The distance between the bands will vary based on the percentage setting.
Trading with Moving Average Envelopes
- Buy Signal: Consider buying when the price approaches the lower band and then starts to rally off of it. This suggests that the price may be reversing from an oversold condition.
- Sell Signal: Conversely, consider selling when the price approaches the upper band and then starts to drop away from it. This indicates that the price may be reversing from an overbought condition.
- Stop-Loss and Take-Profit: Place stop-loss orders just outside the bands to manage risk. Additionally, set take-profit levels based on the risk-reward ratio or when the price reaches the opposite band.
Moving average envelopes provide valuable insights into price extremes and potential reversal points. However, it is important to combine this strategy with other indicators and analysis techniques to enhance its effectiveness.
Moving Average Ribbon
Understanding the Moving Average Ribbon
The moving average ribbon consists of a series of moving averages plotted on the same chart, creating a ribbon-like appearance. The ribbon typically includes a range of EMAs, from very short-term to long-term, providing a comprehensive view of market trends and strength.
The ribbon helps traders identify trend direction and strength by analyzing the alignment and spacing of the moving averages. When the moving averages are closely aligned and spaced out, it indicates a strong trend. Conversely, when the moving averages are close together and overlap, it suggests a weaker trend or potential trend reversal.
One key advantage of the moving average ribbon is its ability to provide visual cues about trend strength and direction. The wider the ribbon and the steeper its angle, the stronger the trend. This visual representation can help traders quickly assess market conditions and make informed trading decisions.
Setting Up the Moving Average Ribbon
- Select Moving Averages: Choose a series of EMAs with varying periods, typically ranging from very short-term (e.g., 5-day) to long-term (e.g., 100-day). The specific periods will depend on your trading style and objectives.
- Plot Moving Averages: Plot the selected EMAs on your chart, using different colors or line styles to distinguish between them. The resulting ribbon will provide a visual representation of market trends.
- Analyze the Ribbon: Observe the alignment and spacing of the moving averages. A wider ribbon with well-spaced EMAs indicates a strong trend, while a narrow ribbon with overlapping EMAs suggests a weaker trend or potential reversal.
Trading with the Moving Average Ribbon
- Trend Confirmation: Use the ribbon to confirm the direction of the trend. When the ribbon is well-aligned and spaced out, it confirms the strength of the trend and suggests that traders should follow the trend direction.
- Entry Signals: Look for crossovers and changes in the ribbon’s shape to identify potential entry points. For example, a crossover of short-term EMAs above long-term EMAs may signal a buying opportunity, while a crossover below may indicate a selling opportunity.
- Exit Signals: Consider exiting trades when the ribbon shows signs of weakening or potential trend reversal. This can be indicated by a narrowing ribbon or crossovers between moving averages.
The moving average ribbon offers a comprehensive view of market trends and strength. By analyzing the alignment and spacing of the moving averages, traders can make more informed decisions and better navigate market conditions.
Moving Average Convergence Divergence (MACD)
Understanding MACD
The Moving Average Convergence Divergence (MACD) is a popular momentum indicator that shows the relationship between two EMAs (typically 12-period and 26-period) and includes a 9-period EMA as a signal line. The MACD histogram represents the difference between the 12-period and 26-period EMAs, providing insights into market momentum and trend direction.
The MACD is useful for identifying changes in momentum, trend direction, and potential buy or sell signals. It helps traders understand whether the market is gaining or losing strength and provides early indications of potential trend reversals.
One key advantage of the MACD is its ability to capture momentum shifts and trend changes. By analyzing the MACD histogram and signal line, traders can gain valuable insights into market conditions and make informed trading decisions.
Setting Up MACD
- Select EMAs: Choose the 12-period and 26-period EMAs for the MACD calculation. These periods can be adjusted based on your trading style and objectives.
- Calculate MACD Line: Subtract the 26-period EMA from the 12-period EMA to obtain the MACD line. This line represents the difference between the two EMAs.
- Calculate Signal Line: Apply a 9-period EMA to the MACD line to obtain the signal line. The signal line provides additional insights into potential buy or sell signals.
- Plot MACD Histogram: Subtract the signal line from the MACD line to obtain the MACD histogram. The histogram represents the difference between the MACD line and the signal line and provides visual cues about momentum shifts.
Trading with MACD
- Buy Signal: A buy signal occurs when the MACD line crosses above the signal line. This crossover indicates that momentum is shifting to the upside and suggests a potential buying opportunity.
- Sell Signal: Conversely, a sell signal occurs when the MACD line crosses below the signal line. This crossover suggests that momentum is shifting to the downside and indicates a potential selling opportunity.
- Divergences: Watch for divergences between the MACD histogram and price action. For example, if the price is making new highs while the MACD histogram is making lower highs, it may signal a potential trend reversal.
The MACD is a versatile indicator that provides valuable insights into market momentum and trend changes. By analyzing the MACD line, signal line, and histogram, traders can gain a deeper understanding of market conditions and make more informed trading decisions.
Guppy Multiple Moving Average (GMMA)
Understanding GMMA
The Guppy Multiple Moving Average (GMMA) is an advanced moving average strategy developed by trader Daryl Guppy. It involves using two sets of moving averages: a short-term set (usually 3, 5, 8, 10, 12, and 15 periods) and a long-term set (usually 30, 35, 40, 45, 50, and 60 periods). This combination helps traders identify market trends, strength, and potential reversals.
The short-term moving averages reflect recent price movements and provide insights into short-term trends, while the long-term moving averages represent broader market trends. By analyzing the relationship between these two sets of moving averages, traders can gain a comprehensive view of market conditions.
One key advantage of the GMMA is its ability to filter out noise and provide a clear view of trend strength and direction. The visual representation of the moving averages creates a ribbon-like appearance, making it easy to identify trends and potential trading signals.
GMMA Strategy Implementation
- Plot GMMA: Plot the short-term and long-term moving averages on your chart. Use different colors or line styles to distinguish between the two sets of moving averages.
- Analyze the Ribbon: Observe the spacing and alignment of the short-term and long-term moving averages. A well-defined ribbon with a clear separation between the short-term and long-term moving averages indicates a strong trend.
- Trend Confirmation: Use the GMMA ribbon to confirm the direction of the trend. When the short-term moving averages are above the long-term moving averages and are diverging, it suggests a strong uptrend. Conversely, when the short-term moving averages are below the long-term moving averages and are diverging, it indicates a strong downtrend.
- Entry and Exit Signals: Look for crossovers between the short-term and long-term moving averages to identify potential entry and exit points. For example, a crossover of the short-term moving averages above the long-term moving averages may signal a buying opportunity, while a crossover below may indicate a selling opportunity.
Real-World Application
The GMMA is widely used by traders to analyze trends and identify potential trading opportunities. Its ability to provide a clear view of trend strength and direction makes it a valuable tool for both trend-following and swing trading strategies.
For example, in a strong uptrend, the GMMA ribbon may show the short-term moving averages consistently above the long-term moving averages. This visual representation confirms the strength of the uptrend and helps traders stay in the market longer. Conversely, in a downtrend, the GMMA ribbon may show the short-term moving averages below the long-term moving averages, indicating a strong bearish trend.
Traders often use the GMMA in conjunction with other technical indicators and analysis techniques to enhance its effectiveness. By combining the GMMA with indicators like the RSI or MACD, traders can gain additional insights into market conditions and improve their trading decisions.
Combining Moving Averages with Other Indicators
RSI and Moving Averages
Understanding RSI
The Relative Strength Index (RSI) is a momentum oscillator that measures the speed and change of price movements. It ranges from 0 to 100 and is typically used to identify overbought or oversold conditions in a market. An RSI reading above 70 is considered overbought, while a reading below 30 is considered oversold.
Combining the RSI with moving averages provides a more comprehensive view of market conditions. While moving averages help identify trends and potential entry and exit points, the RSI offers insights into market momentum and potential reversal points.
Using RSI with Moving Averages
- Trend Confirmation: Use moving averages to confirm the direction of the trend and the RSI to gauge momentum. For example, in an uptrend, look for buy signals when the RSI is in the oversold zone and moving averages indicate a strong trend.
- Divergences: Watch for divergences between the RSI and moving averages. For example, if the price is making new highs while the RSI is making lower highs, it may signal a potential trend reversal.
- Entry and Exit Signals: Combine RSI readings with moving average crossovers to generate trading signals. For example, a crossover of the short-term moving average above the long-term moving average, along with an RSI reading coming out of the oversold zone, may signal a buying opportunity.
Bollinger Bands and Moving Averages
Understanding Bollinger Bands
Bollinger Bands consist of a middle band (usually a 20-day SMA) and two outer bands that are set a certain number of standard deviations away from the middle band. The bands expand and contract based on market volatility, with wider bands indicating higher volatility and narrower bands suggesting lower volatility.
Combining Bollinger Bands with moving averages helps traders understand market volatility and potential price extremes. While moving averages provide insights into trend direction, Bollinger Bands offer information about market volatility and potential reversal points.
Using Bollinger Bands with Moving Averages
- Trend Confirmation: Use moving averages to confirm the direction of the trend and Bollinger Bands to gauge volatility. For example, in an uptrend, look for buy signals when the price is near the lower Bollinger Band and moving averages indicate a strong trend.
- Breakouts: Watch for breakouts from the Bollinger Bands in conjunction with moving average crossovers. For example, a breakout above the upper Bollinger Band, combined with a crossover of the short-term moving average above the long-term moving average, may signal a strong bullish move.
- Volatility Analysis: Use the width of the Bollinger Bands to assess market volatility. A sudden expansion of the bands may indicate a potential trend reversal or a strong price move.
Stochastic Oscillator and Moving Averages
Understanding the Stochastic Oscillator
The Stochastic Oscillator is a momentum indicator that compares a currency pair’s closing price to its price range over a specific period. It ranges from 0 to 100 and is typically used to identify overbought or oversold conditions. Readings above 80 are considered overbought, while readings below 20 are considered oversold.
Combining the Stochastic Oscillator with moving averages provides a more complete view of market conditions. While moving averages help identify trends and potential entry and exit points, the Stochastic Oscillator offers insights into momentum and potential reversal points.
Using the Stochastic Oscillator with Moving Averages
- Trend Confirmation: Use moving averages to confirm the direction of the trend and the Stochastic Oscillator to gauge momentum. For example, in an uptrend, look for buy signals when the Stochastic Oscillator is in the oversold zone and moving averages indicate a strong trend.
- Divergences: Watch for divergences between the Stochastic Oscillator and moving averages. For example, if the price is making new highs while the Stochastic Oscillator is making lower highs, it may signal a potential trend reversal.
- Entry and Exit Signals: Combine Stochastic Oscillator readings with moving average crossovers to generate trading signals. For example, a crossover of the short-term moving average above the long-term moving average, along with a Stochastic Oscillator reading coming out of the oversold zone, may signal a buying opportunity.
Case Studies and Real-Life Examples
Successful Trades Using MAs
Case Study 1: The EUR/USD Trend Trade
In this case study, a trader used the 50-day SMA and 200-day SMA to identify a long-term uptrend in the EUR/USD currency pair. The 50-day SMA crossed above the 200-day SMA, signaling a strong bullish trend. The trader entered a long position and used a trailing stop to lock in profits as the trend continued.
This example highlights the effectiveness of the SMA crossover strategy in identifying strong trends and providing trading signals. By aligning trades with the prevailing market trend, the trader was able to capture significant profits.
Case Study 2: The GBP/JPY EMA Crossover
In this case study, a trader used the 10-day EMA and 50-day EMA crossover strategy to trade the GBP/JPY currency pair. The 10-day EMA crossed above the 50-day EMA, indicating a potential uptrend. The trader entered a long position and used the 50-day EMA as a dynamic support level.
This example demonstrates the responsiveness of the EMA crossover strategy in capturing short-term trends and providing timely trading signals. By combining the EMA crossover with a dynamic support level, the trader was able to manage risk and maximize gains.
Lessons Learned
- Combine Moving Averages with Other Indicators: Moving averages are powerful tools, but their effectiveness is enhanced when combined with other technical indicators and analysis techniques. For example, combining moving averages with RSI or MACD can provide additional insights and improve trading decisions.
- Adapt Strategies to Market Conditions: Different market conditions may require adjustments to moving average strategies. For example, in a highly volatile market, using shorter-term moving averages or adjusting envelope percentages may be more effective.
- Practice and Refine: Successful trading with moving averages requires practice and refinement. Traders should backtest strategies, analyze past trades, and continuously refine their approach to adapt to changing market conditions.
Final Thoughts
Moving averages are versatile tools that provide valuable insights into market trends and potential trading opportunities. By understanding different types of moving averages, implementing various strategies, and combining them with other indicators, traders can enhance their trading decisions and improve their overall performance.
Whether using simple moving averages, exponential moving averages, or advanced strategies like GMMA, moving averages offer valuable information for both trend-following and momentum-based trading strategies. By continuously learning and adapting, traders can make more informed decisions and achieve success in the dynamic world of forex trading.
FAQs
Moving averages are fundamental tools in Forex trading that smooth out price data over a set period to help traders identify trends and potential trading signals. By averaging past prices, moving averages reduce the impact of short-term price fluctuations, providing a clearer picture of the underlying trend. There are two main types: the Simple Moving Average (SMA) and the Exponential Moving Average (EMA). The SMA calculates the average of prices over a specified number of periods, such as 10 days, giving equal weight to all prices in the period. On the other hand, the EMA places more emphasis on recent prices, making it more responsive to current price changes. Both types serve as trend indicators and can help identify potential support and resistance levels.
Choosing the best moving average depends on your specific trading goals and style. For short-term traders, such as day traders, shorter moving averages like the 5-day or 10-day EMA might be preferred because they react more quickly to price changes and can signal short-term trends more effectively. Swing traders who look for opportunities over a few days or weeks might find the 20-day or 50-day EMAs more suitable, as these offer a balance between sensitivity and trend stability. Long-term traders who focus on broader market trends might use longer moving averages, such as the 100-day or 200-day SMA, to filter out the noise and focus on significant trends. It’s important to experiment with different periods and types to see which align best with your trading strategy and timeframe.
The primary difference between the Simple Moving Average (SMA) and the Exponential Moving Average (EMA) lies in their calculation and responsiveness to price changes. The SMA calculates the average of a currency pair’s closing prices over a specific period, giving equal weight to all prices in that period. This makes it a more straightforward tool but also slower to react to recent price movements. In contrast, the EMA gives more weight to recent prices, which makes it more responsive to recent changes and trends. This sensitivity can be advantageous in fast-moving markets, where timely reactions to price shifts are crucial. The choice between SMA and EMA depends on how quickly you need your moving average to reflect recent price changes and how much weight you want to give to recent prices versus historical data.
Moving average crossovers occur when two moving averages of different periods intersect, providing potential buy or sell signals. For example, a common strategy is the crossover of a short-term moving average, like the 10-day EMA, above or below a longer-term moving average, such as the 50-day EMA. A bullish crossover happens when the short-term EMA crosses above the longer-term EMA, suggesting a potential uptrend and a buying opportunity. Conversely, a bearish crossover occurs when the short-term EMA crosses below the longer-term EMA, indicating a potential downtrend and a selling opportunity. These crossovers help traders identify trend changes and adjust their trading positions accordingly. However, they can also produce false signals, especially in choppy or sideways markets, so it’s often beneficial to combine crossover signals with other technical indicators for confirmation.
Moving average envelopes are bands set above and below a moving average by a fixed percentage, used to assess price volatility and potential reversal points. For example, if you use a 20-day SMA as the basis, you might set envelopes 2% above and below this moving average. These envelopes create a range within which the price is expected to fluctuate. Traders look for trading opportunities when the price approaches the envelopes. In an uptrend, buying opportunities might arise when the price nears the lower envelope and begins to rally, while in a downtrend, selling opportunities may occur when the price nears the upper envelope and starts to decline. The width of the envelopes adjusts with market volatility, and narrower envelopes indicate lower volatility while wider envelopes suggest higher volatility. Using envelopes can help traders make decisions based on market conditions and manage risk more effectively.


Leave a Reply
Want to join the discussion?Feel free to contribute!