
How to Use Bollinger Bands
Bollinger Bands are a crucial tool in technical analysis, widely used by traders to assess market volatility and identify potential trading opportunities. Developed by John Bollinger in the 1980s, this indicator consists of three lines: a simple moving average (SMA) and two bands that represent standard deviations from this average. The versatility and effectiveness of Bollinger Bands make them an essential part of any trader’s toolkit. By understanding how to interpret and apply this indicator, traders can enhance their decision-making processes and improve their trading strategies.
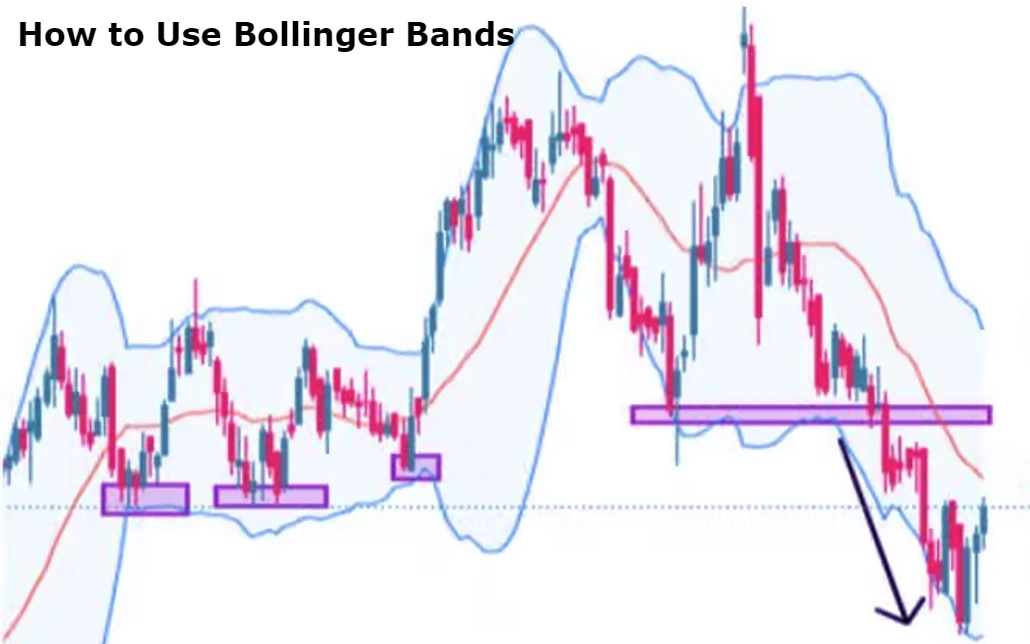
In essence, Bollinger Bands help traders identify overbought or oversold conditions in the market. When prices approach the upper band, it often signals overbought conditions, suggesting that a price pullback may be imminent. Conversely, when prices near the lower band, it can indicate oversold conditions, hinting at a potential price increase. This characteristic makes Bollinger Bands not only a useful indicator for spotting potential market reversals but also an effective tool for gauging market volatility. Understanding how to use Bollinger Bands effectively can provide traders with a significant edge in their trading endeavors.
Contents
- Introduction to Bollinger Bands
- The Components of Bollinger Bands
- How to Calculate Bollinger Bands
- Interpreting Bollinger Bands
- Using Bollinger Bands in Trading Strategies
- Common Mistakes When Using Bollinger Bands
- Combining Bollinger Bands with Other Indicators
- Limitations of Bollinger Bands
- FAQs
- Conclusion
Introduction to Bollinger Bands
Bollinger Bands are an invaluable tool for traders, offering insights into price volatility and market behavior. John Bollinger developed these bands to address the need for a more comprehensive analysis of price movements. The main objective of Bollinger Bands is to provide traders with a visual representation of price volatility, helping them make informed trading decisions. By utilizing this indicator, traders can better understand market dynamics and adjust their strategies accordingly.
One of the key features of Bollinger Bands is their ability to adapt to changing market conditions. The bands expand when volatility increases and contract during periods of low volatility. This dynamic nature allows traders to identify trends and potential reversals more effectively. Bollinger Bands can be applied to various time frames, making them suitable for both day trading and longer-term investments.
Incorporating Bollinger Bands into a trading strategy can significantly enhance decision-making processes. By understanding how to read the bands and their interactions with price movements, traders can identify key entry and exit points. This indicator’s simplicity and effectiveness have made it a favorite among traders, from beginners to seasoned professionals.
The Components of Bollinger Bands
Bollinger Bands consist of three primary components: the middle band (SMA), the upper band, and the lower band. Each of these components plays a vital role in analyzing price movements and volatility.
The Middle Band
The middle band is typically a 20-period simple moving average (SMA) of the asset’s price. This moving average serves as a baseline for measuring price movements. The SMA smooths out price fluctuations, providing traders with a clearer picture of the overall trend. By using the middle band, traders can identify whether the market is in an uptrend, downtrend, or consolidating.
The choice of a 20-period SMA is common among traders, but it can be adjusted based on individual preferences and trading strategies. For instance, some traders may prefer a shorter moving average for more responsive signals, while others may opt for a longer moving average to capture broader trends. Ultimately, the middle band acts as a reference point for assessing price action in relation to historical performance.
The Upper Band
The upper band is calculated by adding two standard deviations to the middle band (SMA). This band represents a potential overbought level, suggesting that prices may be due for a pullback. When prices approach the upper band, it indicates increased buying pressure, which could lead to a reversal or consolidation.
Understanding the calculation of the upper band is crucial for effective trading. As volatility increases, the distance between the upper band and the middle band widens, reflecting heightened market activity. Traders should monitor how often the price touches or crosses the upper band to gauge potential trend reversals or continuation patterns.
The Lower Band
The lower band is calculated by subtracting two standard deviations from the middle band. This band serves as a potential oversold level, indicating that prices may be poised for a rebound. When prices approach the lower band, it suggests increased selling pressure, signaling that the market may be oversold and due for a correction.
Similar to the upper band, the distance between the lower band and the middle band varies with market volatility. When the lower band is breached, it may indicate a strong selling trend, but traders should exercise caution and confirm signals with other indicators before making trading decisions. Understanding the dynamics between the upper and lower bands is essential for accurately interpreting price movements.
How to Calculate Bollinger Bands
Calculating Bollinger Bands involves several steps, including determining the moving average, standard deviation, and ultimately, the upper and lower bands. Traders can easily perform these calculations using various software tools or charting platforms.
Step 1: Calculate the Simple Moving Average (SMA)
The first step in calculating Bollinger Bands is to determine the simple moving average (SMA) of the asset’s price over a specific period. The formula for calculating the SMA is:

Where:
- nnn = number of periods (e.g., 20)
Step 2: Calculate the Standard Deviation
The next step involves calculating the standard deviation of the same set of closing prices. The standard deviation measures the price’s volatility and is calculated using the formula:
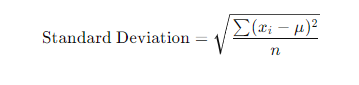
Where:
- xix_ixi = each closing price
- μ\muμ = mean (average) of the closing prices
- nnn = number of periods
Step 3: Calculate the Upper and Lower Bands
Once the SMA and standard deviation are calculated, the upper and lower bands can be determined using the following formulas:
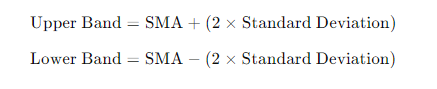
By following these steps, traders can accurately calculate Bollinger Bands and visualize price movements effectively.
Interpreting Bollinger Bands
Understanding how to interpret Bollinger Bands is essential for making informed trading decisions. Traders must be aware of the significance of price interactions with the bands and how these interactions can signal potential market movements.
Price Action and the Bands
When the price approaches the upper band, it is often viewed as a signal of overbought conditions. This indicates that buyers have pushed the price higher, and a reversal or pullback may be imminent. Traders should be cautious when prices touch or exceed the upper band, as it may suggest a potential sell signal.
Conversely, when the price approaches the lower band, it indicates oversold conditions. This situation suggests that sellers have driven the price lower, and a bounce or reversal may occur. Traders can consider this a potential buy signal if the price touches or bounces off the lower band.
Band Width and Volatility
The width of the bands is another critical factor to consider when interpreting Bollinger Bands. A wider band indicates higher volatility, while a narrower band signifies lower volatility. Traders should pay attention to changes in band width, as it can signal upcoming price movements.
When the bands contract, it often suggests a period of low volatility and can precede significant price movements. This contraction may indicate that the market is preparing for a breakout, either upward or downward. Conversely, when the bands expand, it reflects increased volatility, indicating that the price is likely to continue moving in the current direction.
Trend Confirmation
Bollinger Bands can also be used to confirm trends. When prices consistently touch the upper band during an uptrend, it reinforces the strength of the upward movement. Conversely, if prices frequently touch the lower band during a downtrend, it confirms the downward momentum.
Traders should look for confirmations from other technical indicators to strengthen their trading signals. By combining Bollinger Bands with trend indicators, traders can enhance their ability to identify potential entry and exit points.
Using Bollinger Bands in Trading Strategies
Bollinger Bands can be integrated into various trading strategies to enhance decision-making and improve trading outcomes. Here are some effective approaches to utilizing Bollinger Bands in trading.
Trend Following Strategy
A popular strategy involves using Bollinger Bands to identify and follow trends. Traders can look for opportunities when the price consistently touches the upper band during an uptrend or the lower band during a downtrend. This approach allows traders to capture price movements and profit from ongoing trends.
For example, if the price is in an uptrend and frequently touches the upper band, traders may consider entering long positions. They can set stop-loss orders below the middle band to manage risk effectively. Conversely, if the price is in a downtrend and regularly touches the lower band, traders can look for short-selling opportunities.
Reversal Trading Strategy
Bollinger Bands can also be utilized for reversal trading strategies. When prices approach the upper or lower band, traders can anticipate potential reversals. For instance, if the price touches the upper band and starts to pull back, traders may look for confirmation through candlestick patterns or other indicators before entering a short position.
In this strategy, traders can use the middle band as a target for potential exits. Setting stop-loss orders above the upper band for short positions or below the lower band for long positions helps manage risk effectively.
Squeeze Strategy
The squeeze strategy focuses on periods of low volatility when the bands contract. Traders anticipate that significant price movements are likely to occur following a squeeze. When the bands narrow significantly, it indicates a potential breakout, either upward or downward.
Traders can place buy orders above the upper band and sell orders below the lower band, preparing for a breakout in either direction. Confirmation from volume spikes or other technical indicators can further enhance the effectiveness of this strategy.
Common Mistakes When Using Bollinger Bands
While Bollinger Bands are a powerful tool, traders often make common mistakes that can lead to poor decision-making. Being aware of these pitfalls can help traders use Bollinger Bands more effectively.
Overreliance on Bollinger Bands
One of the most significant mistakes traders make is relying solely on Bollinger Bands without considering other technical indicators. While Bollinger Bands provide valuable insights into price movements, they should be used in conjunction with additional indicators to confirm signals and enhance decision-making.
For example, combining Bollinger Bands with momentum indicators like the Relative Strength Index (RSI) can help traders assess whether a market is truly overbought or oversold. Using multiple indicators allows for a more comprehensive analysis of market conditions.
Ignoring Market Context
Traders often overlook the broader market context when using Bollinger Bands. Economic news, market events, and overall sentiment can significantly impact price movements. Failing to consider these factors can lead to misguided trading decisions.
Before entering a trade based on Bollinger Bands, traders should assess the overall market environment and be aware of any upcoming events that may influence prices. This broader perspective can help traders avoid making impulsive decisions based solely on technical indicators.
Misinterpreting Band Breakouts
Another common mistake involves misinterpreting band breakouts. While a price crossing above the upper band or below the lower band may seem like a definitive signal, traders should exercise caution and wait for confirmation before acting.
Band breakouts can lead to false signals, especially in volatile markets. Traders should look for additional confirmation through candlestick patterns or other indicators before making a trade based on a band breakout.
Combining Bollinger Bands with Other Indicators
To enhance the effectiveness of Bollinger Bands, traders can combine them with other technical indicators. This approach allows for more comprehensive analysis and improved trading decisions.
Using RSI with Bollinger Bands
The Relative Strength Index (RSI) is a popular momentum indicator that can complement Bollinger Bands. When prices approach the upper band, traders can check the RSI to determine if the market is overbought. If the RSI is above 70, it reinforces the overbought signal from the Bollinger Bands.
Conversely, when prices touch the lower band, traders can look at the RSI to assess whether the market is oversold. If the RSI is below 30, it adds validity to the oversold signal from the Bollinger Bands. Using both indicators together can improve the accuracy of trading signals.
Combining Bollinger Bands with MACD
The Moving Average Convergence Divergence (MACD) is another powerful indicator that can be effectively combined with Bollinger Bands. The MACD helps traders identify potential trend reversals and momentum shifts.
When prices touch the upper band and the MACD shows signs of divergence, it may indicate a potential reversal. Conversely, if prices approach the lower band and the MACD shows bullish momentum, it may suggest a rebound is forthcoming. By combining these indicators, traders can enhance their analysis and decision-making.
Utilizing Volume Indicators
Volume indicators can also provide valuable insights when used alongside Bollinger Bands. Monitoring volume during price movements can help confirm the strength of a trend. For example, if prices break above the upper band with significant volume, it indicates a strong bullish signal.
On the other hand, if prices breach the lower band on low volume, it may suggest a weak trend or false signal. By incorporating volume indicators, traders can make more informed decisions based on the strength of price movements.
Limitations of Bollinger Bands
While Bollinger Bands are a popular technical analysis tool, they come with limitations that traders should be aware of. Understanding these limitations can help traders use Bollinger Bands more effectively.
Lagging Indicator
Bollinger Bands are considered a lagging indicator, meaning they rely on past price data to generate signals. This characteristic can lead to delayed reactions in rapidly changing market conditions. Traders should be cautious when relying solely on Bollinger Bands, especially in volatile markets where rapid price movements can occur.
To mitigate this limitation, traders should use Bollinger Bands alongside leading indicators that provide earlier signals. This approach allows traders to capture potential opportunities before they become apparent on Bollinger Bands.
False Signals
Bollinger Bands can generate false signals, particularly during choppy market conditions or low-volume trading. Prices may frequently touch the upper or lower bands without a significant trend change, leading to confusion for traders.
To avoid falling victim to false signals, traders should seek confirmation from additional indicators or chart patterns. Utilizing a multi-indicator approach can help validate Bollinger Band signals and improve decision-making.
Not Suitable for All Market Conditions
Bollinger Bands are best suited for trending markets and may not perform as effectively in sideways or consolidating markets. In such conditions, prices may oscillate between the upper and lower bands without providing clear trading signals.
Traders should adapt their strategies based on market conditions. In choppy markets, it may be prudent to avoid relying heavily on Bollinger Bands and instead focus on other indicators that are more suitable for the current environment.
FAQs
Bollinger Bands are a technical analysis tool developed by John Bollinger that consists of three lines: a simple moving average (SMA) in the center and two outer bands that represent standard deviations from the SMA. These bands help traders assess market volatility and identify potential overbought or oversold conditions.
Upper Band: Indicates a potential overbought condition. Prices touching or exceeding this band suggest that the asset may be overvalued and could experience a price pullback.
Lower Band: Indicates a potential oversold condition. Prices touching or nearing this band suggest that the asset may be undervalued and could be due for a price rebound.
Middle Band: Serves as a baseline for measuring price movements and trends.
Bollinger Bands can be effectively combined with various technical indicators to enhance trading decisions:
Relative Strength Index (RSI): Use RSI to confirm overbought or oversold conditions when prices touch the upper or lower bands.
Moving Average Convergence Divergence (MACD): Combine MACD with Bollinger Bands to identify momentum shifts and potential trend reversals.
Volume Indicators: Monitor volume during price movements to confirm the strength of trends or breakouts.
Bollinger Bands can be utilized across various trading styles, including day trading, swing trading, and long-term investing. However, traders should adjust the parameters based on their specific strategies and the asset’s behavior. In trending markets, Bollinger Bands are particularly effective, while they may be less reliable in sideways or consolidating markets.
Yes, Bollinger Bands can be applied to various financial markets, including stocks, forex, commodities, and cryptocurrencies. The principles of volatility and price action they represent are universally applicable across different asset classes. However, traders should consider market-specific characteristics and adjust their strategies accordingly.
Conclusion
Bollinger Bands are a versatile and valuable tool for traders seeking to understand market volatility and price dynamics. By mastering the components, calculations, and interpretations of Bollinger Bands, traders can enhance their decision-making processes and improve their trading outcomes.
While Bollinger Bands offer significant insights into potential market movements, they should be used in conjunction with other indicators and market analysis techniques. By avoiding common mistakes and recognizing the limitations of Bollinger Bands, traders can develop more robust trading strategies that leverage the strengths of this powerful indicator. With practice and experience, Bollinger Bands can become an indispensable part of a trader’s toolkit, aiding in the pursuit of successful trading endeavors.
By integrating Bollinger Bands with other indicators and considering broader market context, traders can gain a more comprehensive understanding of market dynamics, ultimately leading to more informed and strategic trading decisions.


Leave a Reply
Want to join the discussion?Feel free to contribute!