
What Are Fibonacci Retracement Levels?
Fibonacci retracement levels are an essential tool in technical analysis, widely used by traders to identify potential support and resistance levels in financial markets. These levels help predict the future price movements of an asset by analyzing its historical price action. The concept is rooted in the Fibonacci sequence, a series of numbers where each number is the sum of the two preceding ones, leading to certain ratios that traders find significant in their analysis.
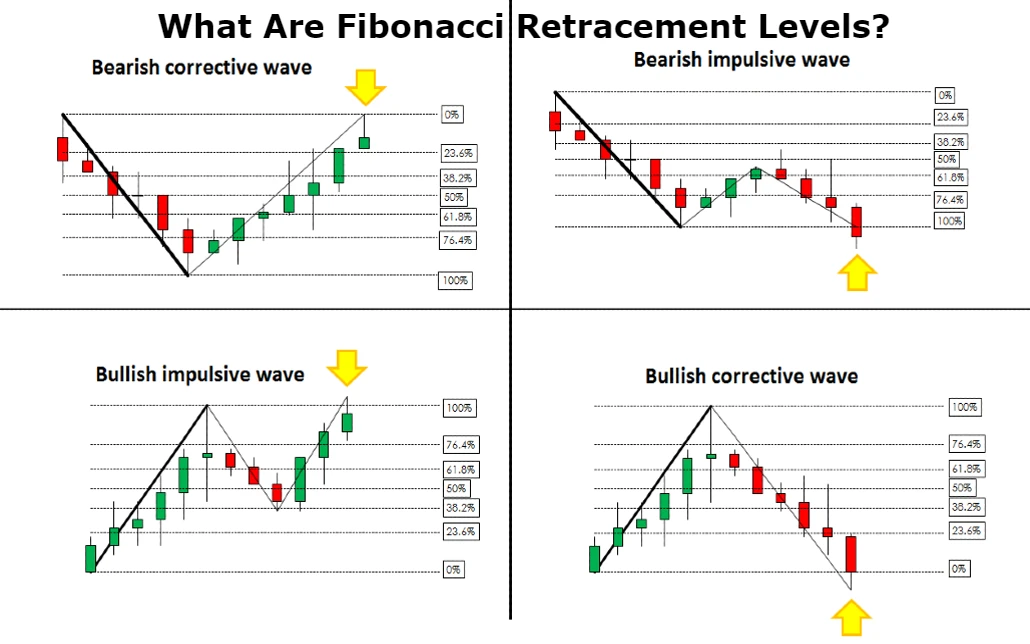
Fibonacci retracement levels typically include 23.6%, 38.2%, 50%, 61.8%, and 78.6%. These percentages represent the expected price retracement levels following a significant price movement. By drawing horizontal lines at these levels, traders can gauge where the price might reverse or stall, thus making informed decisions about entry and exit points in their trading strategies. Understanding these levels can enhance a trader’s ability to manage risks and maximize potential profits.
Contents
- Understanding the Fibonacci Sequence
- Calculating Fibonacci Retracement Levels
- How to Use Fibonacci Retracement Levels in Trading
- Common Fibonacci Retracement Ratios
- Combining Fibonacci Retracement with Other Technical Indicators
- Limitations of Fibonacci Retracement Levels
- Using Fibonacci Extensions for Future Price Projections
- Practical Applications of Fibonacci Retracement in Trading Strategies
- FAQs
- Conclusion
Understanding the Fibonacci Sequence
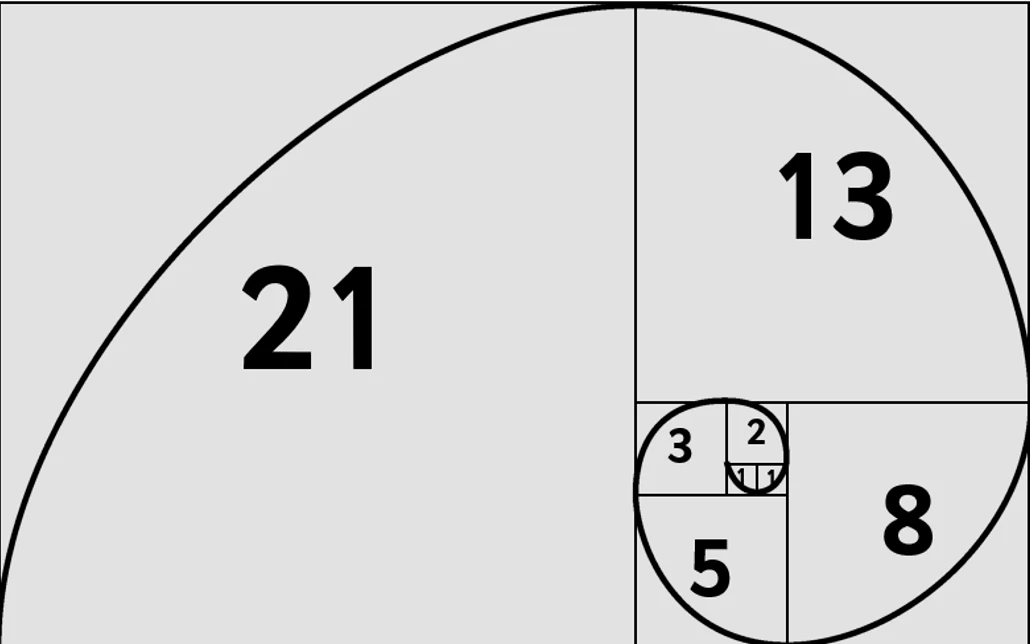
The Fibonacci sequence is a mathematical series that has fascinated mathematicians and scientists for centuries. It begins with the numbers 0 and 1, and each subsequent number is formed by adding the two previous numbers together. The sequence thus starts as follows:
0, 1, 1, 2, 3, 5, 8, 13, 21, 34, 55, 89, 144, and so on.
This sequence has numerous applications across different fields, including mathematics, computer science, and art. In nature, the Fibonacci sequence can be observed in various phenomena, such as the arrangement of leaves on a stem, the branching of trees, and the arrangement of a pine cone’s scales.
The ratios derived from the Fibonacci sequence, especially 61.8% (known as the golden ratio), have particular significance in technical analysis. When a trader divides one Fibonacci number by the next, they consistently arrive at approximately 0.618. This ratio is pivotal in determining potential price levels where reversals or continuations may occur.
The Origin of Fibonacci Retracement Levels
Fibonacci retracement levels owe their name to the Italian mathematician Leonardo Fibonacci, who introduced the sequence to the Western world through his book, “Liber Abaci,” published in 1202. However, it is crucial to note that the sequence itself was known long before Fibonacci’s time, with origins traced back to ancient Indian mathematics. Indian mathematicians, such as Pingala and Virahanka, were using similar concepts centuries prior.
Fibonacci’s introduction of the sequence provided a foundation for further mathematical exploration, leading to its applications in various domains, including finance. In modern trading, Fibonacci retracement levels became prominent in the late 20th century, as traders recognized the value of applying these ratios to price charts.
The development of charting software further popularized Fibonacci retracement levels, allowing traders to visualize these key areas of interest easily. By leveraging Fibonacci retracement levels, traders can assess potential price movements and make informed trading decisions based on historical price action.
Calculating Fibonacci Retracement Levels
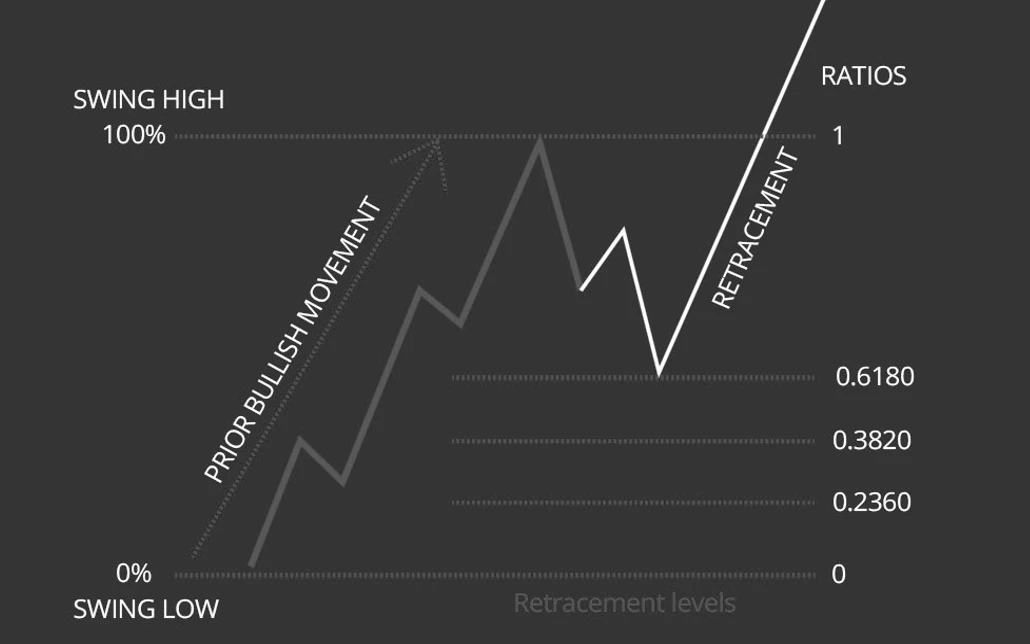
Calculating Fibonacci retracement levels involves identifying two significant price points on a chart: a peak (high) and a trough (low). These two points create the price range over which the Fibonacci levels will be calculated. The primary steps involved in calculating Fibonacci retracement levels are as follows:
- Identify Significant Price Points: Start by identifying the most recent high and low points on the price chart. This could be a recent swing high and low in the asset’s price movement.
- Calculate the Price Range: Determine the price range between the high and low points. For example, if the high point is $100 and the low point is $50, the price range would be $100 – $50 = $50.
- Apply Fibonacci Ratios: Use the calculated price range to determine the retracement levels based on Fibonacci ratios. The levels are calculated as follows:
- 23.6% Level: Low + (Price Range * 0.236)
- 38.2% Level: Low + (Price Range * 0.382)
- 50% Level: Low + (Price Range * 0.5)
- 61.8% Level: Low + (Price Range * 0.618)
- 78.6% Level: Low + (Price Range * 0.786)
For instance, using the example of a price range from $50 to $100, the calculations for each level would be as follows:
| Fibonacci Level | Calculation | Result |
|---|---|---|
| 23.6% | $50 + ($50 * 0.236) | $61.80 |
| 38.2% | $50 + ($50 * 0.382) | $69.10 |
| 50% | $50 + ($50 * 0.5) | $75.00 |
| 61.8% | $50 + ($50 * 0.618) | $80.90 |
| 78.6% | $50 + ($50 * 0.786) | $93.00 |
This table provides a clear representation of the Fibonacci retracement levels derived from the price range. By plotting these levels on a chart, traders can visualize potential support and resistance areas that may influence price movements.
The Role of Fibonacci Ratios in Trading
Fibonacci retracement levels serve as key indicators in trading strategies. Traders often use them to identify potential reversal points in the market, making them crucial for developing entry and exit strategies. The primary roles of Fibonacci ratios in trading include:
- Identifying Potential Support and Resistance: Traders view Fibonacci levels as areas where price action may stall or reverse. For instance, if a stock price retraces to the 61.8% level and shows signs of reversal, traders may consider it a buy signal, anticipating a rebound.
- Setting Stop-Loss Levels: Traders often use Fibonacci levels to establish stop-loss orders. For example, if a trader buys a stock at the 61.8% retracement level, they might set a stop-loss just below that level. If the price falls below this level, it may indicate that the trade is not performing as expected, prompting the trader to exit the position.
- Determining Price Targets: Fibonacci levels can also assist traders in setting price targets. For instance, if a trader enters a long position after a price bounce at the 38.2% level, they may aim to sell at the previous high or the next Fibonacci extension level.
Overall, Fibonacci retracement levels are a vital component of a trader’s toolkit. They provide essential insights into potential market behavior, helping traders make informed decisions in an ever-changing financial landscape.
How to Use Fibonacci Retracement Levels in Trading
Incorporating Fibonacci retracement levels into a trading strategy requires a systematic approach. Traders should follow these steps to effectively utilize Fibonacci levels in their analyses:
- Select Appropriate Timeframes: The choice of timeframe is crucial when using Fibonacci retracement levels. Traders should select a timeframe that aligns with their trading style, whether day trading, swing trading, or long-term investing. For instance, day traders may focus on shorter timeframes, while swing traders may analyze daily or weekly charts.
- Identify Key Price Points: After selecting a timeframe, the trader should identify significant high and low price points to establish the range for Fibonacci calculations. This process may involve reviewing recent price movements, trends, and patterns to determine the most relevant levels.
- Draw Fibonacci Levels: Using charting software or trading platforms, traders can easily draw Fibonacci retracement levels on the selected price chart. The software will automatically calculate the Fibonacci levels based on the chosen high and low points, allowing for quick visualization.
- Analyze Price Action: Once the Fibonacci levels are drawn, traders should monitor price action around these levels. Look for patterns such as candlestick formations, volume spikes, or trend reversals that provide additional confirmation of potential price movements.
- Integrate with Other Technical Indicators: For enhanced accuracy, traders should consider integrating Fibonacci retracement levels with other technical indicators, such as moving averages, RSI (Relative Strength Index), or MACD (Moving Average Convergence Divergence). This multi-faceted approach can help confirm potential buy or sell signals.
Practical Examples of Fibonacci Retracement Usage
To illustrate the practical application of Fibonacci retracement levels, consider the following examples:
Example 1: Bullish Scenario
Imagine a stock that recently rallied from $50 to $100. Following this upward movement, the stock retraces to the 61.8% Fibonacci level at $80.90. As the price approaches this level, traders observe bullish candlestick patterns, indicating a potential reversal. A trader may decide to enter a long position at this level, anticipating a rally back towards the previous high of $100. In this case, setting a stop-loss order below the 61.8% level protects against adverse price movements.
Example 2: Bearish Scenario
Conversely, consider a stock that has declined from $150 to $100. After reaching this low, the price retraces to the 38.2% level at $115. As the price approaches this level, the trader notices bearish divergence on the RSI, suggesting that momentum is weakening. This could indicate a potential reversal. In this scenario, the trader may opt to enter a short position at $115, expecting the price to resume its downward trajectory. A stop-loss order can be placed above the 38.2% level to manage risk.
Example 3: Long-Term Investment Decision
Fibonacci retracement levels can also aid long-term investors in making decisions. Suppose an investor identifies a stock that has experienced a significant rally and subsequently retraced to the 50% level after hitting an all-time high. The investor can analyze the retracement in the context of overall market trends and fundamentals to determine whether the stock is undervalued. If the investor believes in the company’s long-term growth potential, they may decide to buy at this retracement level, viewing it as a buying opportunity.
Common Fibonacci Retracement Ratios
The most commonly used Fibonacci retracement ratios are as follows:
- 23.6%: This level represents a minor retracement and is often used in conjunction with other indicators to identify potential entry points.
- 38.2%: This level indicates a more substantial retracement and is considered a critical support or resistance area. Traders often monitor price action at this level for potential reversals.
- 50%: Although not a Fibonacci ratio, the 50% level is widely recognized in trading. It represents a significant retracement point where price action may stabilize or reverse.
- 61.8%: Known as the golden ratio, this level is often viewed as a strong support or resistance area. Many traders consider it a critical level for potential reversals.
- 78.6%: This level represents a deeper retracement and is less commonly used than the others but can still provide valuable insights into price movements.
Visualizing Fibonacci Retracement Levels on Charts
To effectively utilize Fibonacci retracement levels, traders must understand how to visualize these levels on price charts. A well-structured chart can enhance decision-making and improve trading strategies.
- Charting Platforms: Most trading platforms offer built-in tools for drawing Fibonacci retracement levels. Traders can select the Fibonacci tool and click on the high and low points of the price range. The software will automatically generate the levels.
- Color-Coding Levels: To enhance readability, traders may choose to color-code the Fibonacci levels. For example, they might use green for bullish levels (23.6% and 38.2%) and red for bearish levels (61.8% and 78.6%). This visual distinction helps traders quickly identify potential entry or exit points.
- Combining with Candlestick Patterns: To increase the effectiveness of Fibonacci levels, traders should observe candlestick patterns at these key levels. For instance, if a bullish engulfing pattern appears at the 61.8% level, it may provide further confirmation of a potential price reversal.
| Fibonacci Level | Description | Common Usage |
|---|---|---|
| 23.6% | Minor retracement level | Entry point for short-term trades |
| 38.2% | Critical support/resistance | Monitor for reversals |
| 50% | Significant retracement | Used for stop-loss placement |
| 61.8% | Strong support/resistance | Key level for potential reversals |
| 78.6% | Deeper retracement | Less common, still relevant |
This table summarizes the Fibonacci levels, their descriptions, and their common uses in trading, aiding in decision-making processes.
Combining Fibonacci Retracement with Other Technical Indicators
While Fibonacci retracement levels provide valuable insights on their own, combining them with other technical indicators can enhance a trader’s ability to make informed decisions. Here are some effective combinations:
- Moving Averages: Moving averages can help confirm the trend direction. When the price approaches a Fibonacci level that coincides with a moving average, it increases the likelihood of a price reversal. For instance, if the price is retracing to the 38.2% level and aligns with the 50-day moving average, it may serve as a stronger support level.
- Relative Strength Index (RSI): The RSI is a momentum oscillator that measures overbought and oversold conditions. If the price is nearing a Fibonacci level while the RSI shows an overbought condition, it may indicate a potential reversal. Traders may use this information to make more informed entry or exit decisions.
- MACD (Moving Average Convergence Divergence): The MACD is a trend-following momentum indicator that can help identify potential reversals. When the price approaches a Fibonacci level, traders can analyze the MACD for bullish or bearish crossovers, providing additional confirmation for their trading decisions.
Example: Combining Fibonacci with Moving Averages
Consider a scenario where a stock is in a strong uptrend. The price rallies from $50 to $100, then retraces to the 61.8% Fibonacci level at $80.90. Simultaneously, the 50-day moving average is positioned at $81. This alignment may provide traders with a compelling reason to enter a long position, as the convergence of the Fibonacci level and the moving average creates a stronger support area.
Limitations of Fibonacci Retracement Levels
Despite their popularity and utility, Fibonacci retracement levels have inherent limitations that traders should be aware of. Understanding these limitations can help traders use Fibonacci levels more effectively:
- No Guarantees: Fibonacci retracement levels do not guarantee price reversals or stalling points. Prices may breach these levels without significant reaction. Traders should be cautious not to rely solely on Fibonacci levels for trading decisions.
- Subjectivity in Analysis: Identifying significant high and low points can be subjective. Different traders may select different points, leading to variations in the calculated Fibonacci levels. This subjectivity can result in conflicting interpretations of potential support and resistance areas.
- Multiple Fibonacci Levels: Given the numerous Fibonacci levels available, traders may find it challenging to determine which level is the most relevant. A price might approach multiple levels, making it difficult to ascertain which one will influence the price action.
A trader may identify a 61.8% Fibonacci retracement level but observe that the price continues to decline below this level. In such cases, it’s essential to combine the analysis with other indicators, such as volume or candlestick patterns, to confirm the strength of the price movement. This multi-faceted approach helps mitigate the risks associated with relying solely on Fibonacci levels.
Using Fibonacci Extensions for Future Price Projections
While Fibonacci retracement levels focus on potential reversals during a retracement, Fibonacci extensions provide insights into potential future price movements following a price breakout. Fibonacci extensions are useful for identifying target levels when the price continues in the direction of the trend after a retracement.
- Identifying Extension Levels: The key Fibonacci extension levels are 161.8%, 261.8%, and 423.6%. These levels can be plotted on the chart by selecting the same high and low points used for retracement analysis, but applying different Fibonacci ratios for extension calculations.
- Example of Fibonacci Extensions: If a stock rallies from $100 to $150 and retraces to $120, traders can calculate the extension levels based on the original price movement. The 161.8% extension level would provide a potential target for traders looking to capitalize on the continued price movement.
| Fibonacci Extension Level | Description | Potential Usage |
|---|---|---|
| 161.8% | First major extension level | Target for price breakout |
| 261.8% | Second extension level | Further target for aggressive trades |
| 423.6% | Third extension level | Rarely reached, indicates strong trends |
This table summarizes the Fibonacci extension levels, their descriptions, and potential uses, aiding traders in future price projection strategies.
Practical Applications of Fibonacci Retracement in Trading Strategies
Traders can effectively incorporate Fibonacci retracement levels into various trading strategies. Here are some practical applications of Fibonacci retracement levels:
- Trend Trading: Traders can use Fibonacci levels to identify potential pullbacks within a trending market. For instance, if a stock is in an uptrend and retraces to the 38.2% level, traders may enter long positions, anticipating a continuation of the upward trend.
- Swing Trading: Swing traders can utilize Fibonacci levels to identify short-term price swings. After a strong price movement, they can look for retracement opportunities at Fibonacci levels to enter trades with favorable risk-reward ratios.
- Risk Management: Fibonacci retracement levels can also play a crucial role in risk management. Traders can set stop-loss orders just below significant Fibonacci levels to protect their capital. By using these levels, traders can establish defined risk parameters for their trades.
Example: Trend Trading with Fibonacci Levels
In a trending market, suppose a stock has risen from $30 to $60. After reaching this high, it retraces to the 38.2% Fibonacci level at $50. A trader monitoring this price action may decide to enter a long position, anticipating a continuation of the uptrend. They could place a stop-loss order below the 50% level to manage risk effectively.
FAQs
To calculate Fibonacci retracement levels, first identify two significant price points: a high and a low. Then, determine the price range between these points. Multiply the price range by the Fibonacci ratios (23.6%, 38.2%, 50%, 61.8%, 78.6%) and subtract or add this value from the high or low price to establish the retracement levels.
Traders use Fibonacci retracement levels to identify potential reversal points in the market. When a price retraces to a key Fibonacci level, traders may look for signs of a reversal, such as candlestick patterns or other technical indicators, to inform their entry or exit decisions.
While Fibonacci retracement levels can indicate potential areas where price may reverse, they do not guarantee outcomes. Prices may breach these levels without significant reaction. Therefore, traders often combine Fibonacci analysis with other technical indicators to enhance their predictions.
Fibonacci retracement levels can be applied across various financial markets, including stocks, currencies, commodities, and cryptocurrencies. Their effectiveness can vary based on market conditions, volatility, and the specific asset being analyzed. Traders should consider the context of the market and use additional indicators for confirmation.
Yes, beginners can use Fibonacci retracement levels as part of their trading strategy. However, it’s essential for novice traders to familiarize themselves with the concepts of technical analysis and practice using these levels in conjunction with other indicators to make informed trading decisions.
To improve trading results with Fibonacci retracement levels, consider combining them with other technical analysis tools, such as moving averages, RSI, and MACD. Additionally, practice identifying key price points, analyze price action at Fibonacci levels, and stay updated on market trends to make more informed trading decisions.
Conclusion
Fibonacci retracement levels are invaluable tools for traders, offering insights into potential support and resistance areas in financial markets. By understanding the Fibonacci sequence, calculating retracement levels, and integrating them with other technical indicators, traders can enhance their trading strategies and make more informed decisions.
While Fibonacci levels provide essential guidance, traders should remain mindful of their limitations and incorporate them into a broader analysis framework. By doing so, they can navigate the complexities of the financial markets more effectively, increasing their chances of success.
Incorporating Fibonacci retracement levels into trading strategies not only aids in decision-making but also enhances risk management. As with any trading tool, practice and experience will further refine a trader’s ability to utilize Fibonacci levels effectively, paving the way for successful trading outcomes.


Leave a Reply
Want to join the discussion?Feel free to contribute!