Forex Market Analysis
Forex market analysis is a critical process for traders who seek to understand and predict the movements of currency pairs. This comprehensive guide delves into various aspects of forex analysis, focusing on both fundamental and technical perspectives. By examining key economic indicators, historical price patterns, and technical indicators, traders can make informed decisions to optimize their trading strategies.
Contents
Understanding Forex Market Analysis
Forex market analysis involves studying and interpreting data to make predictions about future currency movements. It is essential for traders to identify trends, potential entry and exit points, and market sentiment. The two main types of forex analysis are fundamental and technical analysis, each providing unique insights.
What is Forex Analysis?
Forex analysis is the process of evaluating currency pair price changes and the factors influencing those changes. It involves a thorough examination of economic indicators, geopolitical events, and historical price data to make informed trading decisions. Traders use a combination of fundamental and technical analysis to enhance their trading strategies and improve their chances of success.
The Importance of Forex Analysis
Forex analysis is vital for traders as it helps them:
- Identify Trends: Understanding whether a currency pair is in an uptrend, downtrend, or range-bound.
- Make Informed Decisions: Based on data and analysis, traders can decide whether to buy, sell, or hold a position.
- Manage Risks: By predicting potential market movements, traders can set stop-loss and take-profit levels to manage their risks effectively.

Fundamental Analysis in Forex
Fundamental analysis in forex involves evaluating economic, political, and social factors that influence currency prices. It provides insights into the overall health of an economy and helps traders anticipate future currency movements.
Key Economic Indicators
Economic indicators are vital for fundamental analysis. They provide a snapshot of a country’s economic performance and influence currency values. Key indicators include:
Gross Domestic Product (GDP)
GDP measures the total value of goods and services produced in a country. A growing GDP indicates a healthy economy, which can strengthen the national currency.
| Country | Q1 GDP Growth (%) | Q2 GDP Growth (%) | Q3 GDP Growth (%) | Q4 GDP Growth (%) |
|---|---|---|---|---|
| USA | 2.1 | 3.5 | 2.9 | 3.0 |
| UK | 1.3 | 1.6 | 1.9 | 2.2 |
| Japan | 1.0 | 1.2 | 1.4 | 1.6 |
Unemployment Rate
The unemployment rate measures the percentage of the labor force that is unemployed and actively seeking employment. Lower unemployment rates generally indicate a stronger economy and currency.
Inflation Rate
Inflation measures the rate at which the general price level of goods and services is rising. Central banks monitor inflation closely to adjust interest rates accordingly.
Interest Rates
Interest rates set by central banks influence currency values. Higher interest rates attract foreign investment, increasing demand for the national currency.
Central Bank Policies
Central banks play a crucial role in forex markets. Their policies, including interest rate decisions and monetary policy statements, can significantly impact currency values. Traders closely follow central bank announcements to anticipate market movements.
Federal Reserve (Fed)
The Federal Reserve’s interest rate decisions and economic outlook reports influence the USD’s value. Hawkish statements (favoring higher interest rates) can strengthen the USD, while dovish statements (favoring lower interest rates) can weaken it.

European Central Bank (ECB)
The ECB’s monetary policy, including interest rates and asset purchase programs, affects the EUR’s value. Traders analyze ECB statements and press conferences for insights into future policy changes.
Bank of Japan (BoJ)
The BoJ’s policies, particularly its stance on negative interest rates and quantitative easing, impact the JPY. Traders monitor BoJ announcements for indications of policy shifts.
Geopolitical Events
Geopolitical events, such as elections, trade negotiations, and international conflicts, can cause significant currency fluctuations. Traders need to stay informed about global news to anticipate market reactions.
Elections
Elections can lead to political uncertainty, affecting investor confidence and currency values. For example, a presidential election in the USA can influence the USD’s strength based on the perceived economic policies of the candidates.
Trade Negotiations
Trade agreements or disputes between countries can impact currency values. Positive trade negotiations can strengthen the involved currencies, while trade wars can lead to depreciation.
Conflicts and Crises
Geopolitical conflicts, such as wars or financial crises, can cause currency volatility. Safe-haven currencies like the USD, JPY, and CHF often appreciate during periods of uncertainty.
Technical Analysis in Forex
Technical analysis involves studying historical price data and patterns to predict future currency movements. It relies on various tools and techniques to identify trends, support and resistance levels, and potential entry and exit points.
Price Trends
Understanding price trends is fundamental to technical analysis. A trend indicates the general direction in which a currency pair is moving. There are three main types of trends:
Uptrend
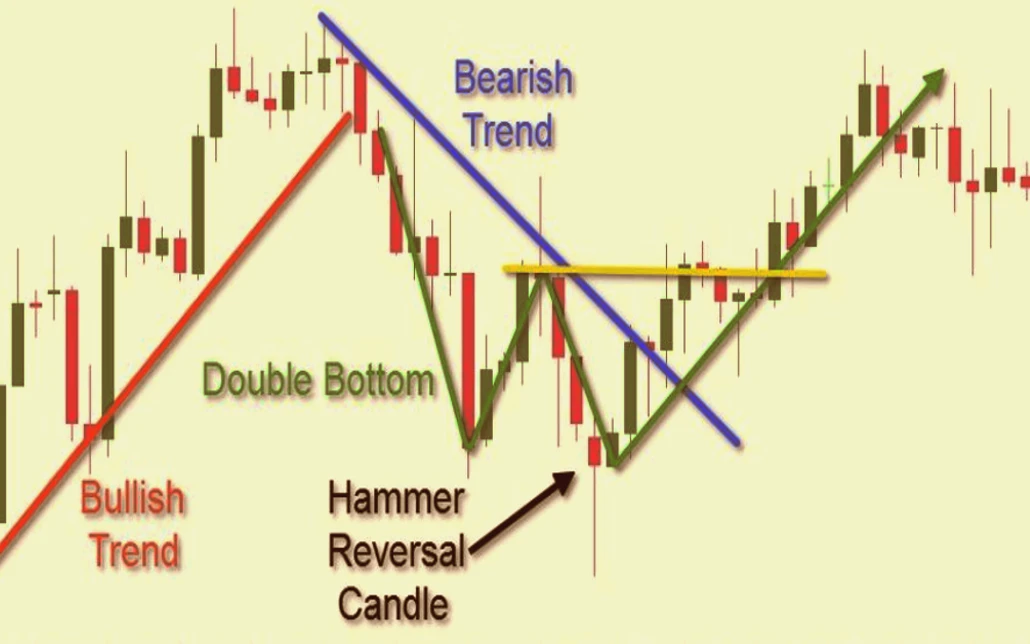
An uptrend is characterized by higher highs and higher lows. It indicates that the currency pair’s value is increasing over time.
Downtrend
A downtrend is characterized by lower highs and lower lows. It indicates that the currency pair’s value is decreasing over time.
Sideways Trend
A sideways trend, or range-bound market, occurs when the currency pair’s price moves within a horizontal range, showing no clear upward or downward direction.
Support and Resistance Levels
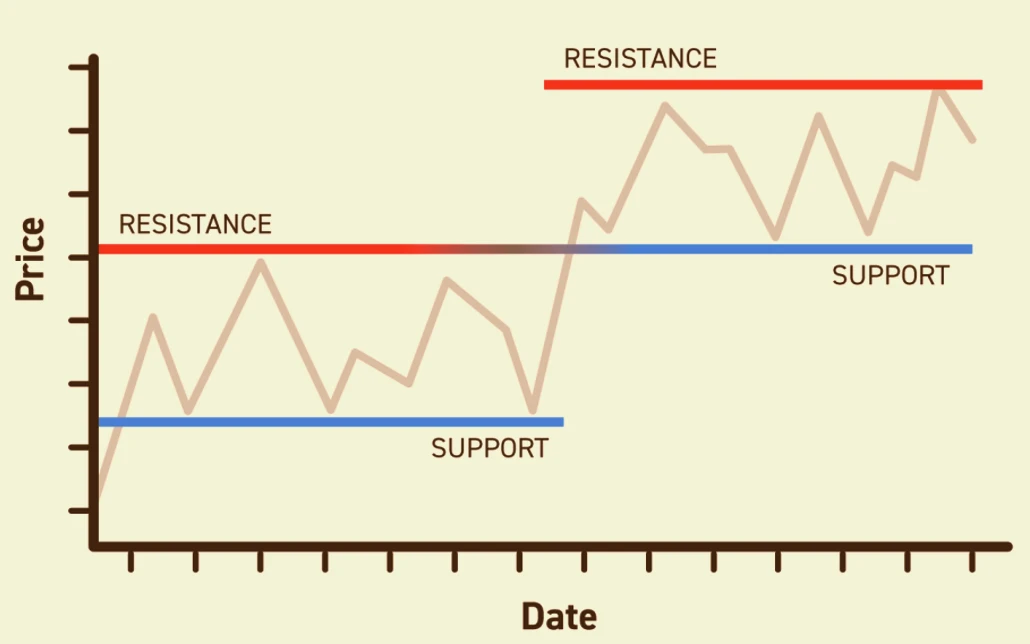
Support and resistance levels are key price points where a currency pair tends to reverse its direction.
Support Level
A support level is a price point where the currency pair tends to find buying interest, preventing it from falling further.
Resistance Level
A resistance level is a price point where the currency pair tends to find selling interest, preventing it from rising further.

Chart Patterns
Chart patterns are shapes formed by the price movements of a currency pair. Recognizing these patterns can help traders predict future price movements.
Head and Shoulders
The head and shoulders pattern indicates a potential trend reversal. It consists of a peak (shoulder), followed by a higher peak (head), and then another lower peak (shoulder).
Double Top and Double Bottom
A double top pattern indicates a potential bearish reversal, while a double bottom pattern indicates a potential bullish reversal. These patterns consist of two peaks or troughs at roughly the same price level.
Triangles
Triangles are continuation patterns that indicate a pause in the current trend. They can be ascending, descending, or symmetrical.
Technical Indicators
Technical indicators are mathematical calculations based on historical price data. They help traders identify trends, momentum, and potential reversal points.
Moving Averages
Moving averages smooth out price data to identify trends. The two main types are simple moving averages (SMA) and exponential moving averages (EMA).
Relative Strength Index (RSI)
The RSI measures the speed and change of price movements. It ranges from 0 to 100 and helps identify overbought or oversold conditions.
Moving Average Convergence Divergence (MACD)
The MACD is a trend-following indicator that shows the relationship between two moving averages. It consists of the MACD line, signal line, and histogram.
| Indicator | Description | Calculation |
|---|---|---|
| SMA | Average price over a specified period | (Sum of prices) / (Number of periods) |
| EMA | Weighted average of prices | EMA = (Price – EMA(previous)) * multiplier + EMA(previous) |
| RSI | Momentum oscillator | 100 – [100 / (1 + RS)] |
| MACD | Trend-following momentum indicator | MACD = 12-period EMA – 26-period EMA |

Combining Fundamental and Technical Analysis
Many traders use a hybrid approach that combines both fundamental and technical analysis to gain a comprehensive view of the forex market. This approach allows traders to make more informed decisions by considering both economic factors and price patterns.
Benefits of a Hybrid Approach
Comprehensive Analysis
Combining both methods provides a broader perspective, helping traders understand the underlying factors driving market movements and the technical aspects of price action.
Better Timing
While fundamental analysis helps identify potential long-term trends, technical analysis can assist in timing entry and exit points more precisely.
Risk Management
A hybrid approach allows traders to manage risks more effectively by considering both economic events and technical signals.
Practical Example: EUR/USD Analysis
To illustrate how a hybrid approach works, consider analyzing the EUR/USD currency pair.
Fundamental Analysis
- Economic Indicators: Monitor GDP growth rates, employment data, and inflation trends in both the Eurozone and the USA.
- Central Bank Policies: Follow the ECB and Fed for interest rate decisions and policy statements.
- Geopolitical Events: Stay informed about political developments in the Eurozone and the USA.
Technical Analysis
- Price Trends: Determine if EUR/USD is in an uptrend, downtrend, or sideways trend.
- Support and Resistance Levels: Identify key levels where the price has historically found support or resistance.
- Technical Indicators: Use moving averages, RSI, and MACD to gauge market sentiment and potential reversal points.
By combining insights from both fundamental and technical analysis, traders can make more informed decisions and improve their trading strategies.
Real-World Examples of Forex Analysis
Case Study: USD/JPY
Fundamental Analysis
- Economic Indicators: Analyze GDP growth, inflation, and employment data in the USA and Japan.
- Central Bank Policies: Monitor the Fed and BoJ for interest rate decisions and policy statements.
- Geopolitical Events: Consider the impact of trade negotiations and geopolitical tensions on the USD and JPY.
Technical Analysis
- Price Trends: Identify whether USD/JPY is in an uptrend, downtrend, or range-bound market.
- Support and Resistance Levels: Determine key levels where the price has found support or resistance.
- Technical Indicators: Use moving averages, RSI, and MACD to identify trends and potential reversal points.
Case Study: GBP/USD
Fundamental Analysis
- Economic Indicators: Monitor GDP growth, inflation, and employment data in the UK and USA.
- Central Bank Policies: Follow the Bank of England (BoE) and Fed for interest rate decisions and policy statements.
- Geopolitical Events: Consider the impact of Brexit developments and UK political events on the GBP.
Technical Analysis
- Price Trends: Identify whether GBP/USD is in an uptrend, downtrend, or range-bound market.
- Support and Resistance Levels: Determine key levels where the price has found support or resistance.
- Technical Indicators: Use moving averages, RSI, and MACD to identify trends and potential reversal points.
Advanced Forex Analysis Techniques
Sentiment Analysis
Sentiment analysis involves gauging market sentiment to understand how traders feel about a particular currency pair. This can be done through various methods, such as analyzing news headlines, social media posts, and trader surveys.
Sentiment Indicators
- Commitment of Traders (COT) Report: Published by the Commodity Futures Trading Commission (CFTC), this report shows the positions of large traders in the futures market.
- Sentiment Indexes: Various financial websites and platforms offer sentiment indexes that show the percentage of traders who are bullish or bearish on a currency pair.
Intermarket Analysis
Intermarket analysis involves examining the relationships between different financial markets, such as stocks, bonds, commodities, and currencies. This approach helps traders understand how movements in one market can impact another.
Key Relationships
- Stock Markets and Currencies: Stock market performance can influence currency values, as investors move capital between markets.
- Commodity Prices and Currencies: Prices of commodities like oil and gold can impact commodity-linked currencies (e.g., CAD, AUD).
- Bond Yields and Currencies: Changes in bond yields can influence currency values, as higher yields attract foreign investment.
Seasonal Patterns
Seasonal patterns refer to recurring trends in the forex market that occur at specific times of the year. Traders can use these patterns to anticipate market movements based on historical data.
Examples of Seasonal Patterns
- January Effect: Some currencies tend to show increased volatility in January due to portfolio rebalancing and new investment strategies.
- Summer Doldrums: Trading volumes may decrease during the summer months, leading to lower volatility and range-bound markets.
Forex Trading Strategies
Trend Following
Trend following strategies aim to capitalize on the momentum of an existing trend. Traders identify trends and enter positions in the direction of the trend.
Key Components
- Moving Averages: Use moving averages to identify the direction of the trend.
- Trend Lines: Draw trend lines to visualize the trend and potential breakout points.
- Trailing Stops: Use trailing stops to lock in profits while allowing the trade to run as long as the trend continues.
Range Trading
Range trading strategies involve identifying support and resistance levels and trading within the defined range. Traders buy at support and sell at resistance.
Key Components
- Support and Resistance Levels: Identify key levels where the price has historically reversed.
- Oscillators: Use oscillators like RSI and Stochastic to identify overbought and oversold conditions within the range.
- Risk Management: Set stop-loss and take-profit levels to manage risks effectively.
Breakout Trading
Breakout trading strategies aim to capitalize on significant price movements that occur when the price breaks out of a defined range or pattern.
Key Components
- Chart Patterns: Identify patterns like triangles, flags, and head and shoulders that indicate potential breakouts.
- Volume: Monitor trading volume to confirm the strength of the breakout.
- Entry and Exit Points: Set entry points just above resistance for bullish breakouts and just below support for bearish breakouts.
Conclusion
Forex market analysis is a multifaceted process that involves both fundamental and technical analysis. By understanding economic indicators, central bank policies, geopolitical events, price trends, support and resistance levels, chart patterns, and technical indicators, traders can make informed decisions and develop effective trading strategies. Combining these analytical methods provides a comprehensive view of the forex market, enabling traders to optimize their performance and manage risks effectively. Continuous learning and practice are essential for mastering forex analysis and achieving long-term success in the dynamic world of forex trading.


Leave a Reply
Want to join the discussion?Feel free to contribute!