
Position Trading in Forex
Position trading in the forex market is a strategy focused on holding positions for extended periods to benefit from long-term market trends. Unlike day trading or swing trading, position trading requires a broader view of market fundamentals and a patient approach. This comprehensive guide will cover everything you need to know about position trading, including its definition, strategies, risk management techniques, and tools.
Contents
What is Position Trading?
Definition and Core Concepts
Position trading is a long-term trading strategy where positions are held for months or even years to exploit major price movements. This strategy contrasts sharply with day trading, where positions are held for a few hours, or swing trading, where trades might last from a few days to a few weeks. Position traders aim to capitalize on broader economic and financial trends, making this approach more akin to traditional investing but within the realm of forex trading.
In practice, position traders use a combination of fundamental and technical analysis to make trading decisions. They look at long-term economic indicators, such as GDP growth, interest rates, and political stability, to forecast where a currency pair might be headed. They then enter trades based on these forecasts, holding onto their positions for extended periods to see the long-term trend fully materialize. This method requires a significant amount of patience and a strong understanding of market fundamentals, as the trader must endure price fluctuations without reacting impulsively.
Personal Experience: When I first started with position trading, I found the patience required to be a real challenge. I recall a particular trade in the EUR/USD pair where my initial analysis suggested a long-term uptrend. Despite facing several months of market fluctuations and near-term retracements, sticking to my strategy eventually paid off as the market moved in the anticipated direction.
Key Characteristics of Position Trading
Position trading is defined by several key characteristics that distinguish it from other trading strategies. Firstly, it requires patience. Unlike day traders who seek quick profits, position traders are willing to wait for their trades to play out over a longer period. This means they often endure periods of market volatility without making frequent adjustments to their positions.
Secondly, position traders must have a strong understanding of both fundamental and technical analysis. They use fundamental analysis to evaluate economic conditions and identify long-term trends, while technical analysis helps in timing their entries and exits. Position traders typically use longer-term charts and indicators to guide their decisions. This approach contrasts with shorter-term traders who rely more heavily on immediate price movements and technical patterns.
Personal Insight: One of the most valuable lessons I learned was the importance of not getting swayed by short-term market noise. There were times when the market moved against my position in the short term, causing anxiety. However, focusing on the long-term trend and sticking to the plan was crucial. It was a learning curve to remain steadfast and not let temporary market movements derail my strategy.
How Position Trading Differs from Other Strategies
Position trading differs significantly from day trading and swing trading. Day traders focus on short-term price movements, holding positions for minutes to hours. They rely heavily on technical analysis and are often involved in numerous trades per day, aiming to profit from small price changes. Swing traders, on the other hand, hold positions for a few days to weeks, targeting short- to medium-term price swings. Their strategy also involves a mix of technical and fundamental analysis but over a shorter timeframe compared to position traders.
In contrast, position traders base their trades on long-term trends driven by economic fundamentals. They hold their trades for months or even years, often ignoring short-term fluctuations. This approach requires a comprehensive understanding of macroeconomic factors and the ability to withstand significant market movements without immediate reactions. Position traders are less concerned with day-to-day price action and more focused on the broader economic picture.
Example: If a position trader identifies a strong economic growth trend in a country, they may take a long position in the country’s currency, expecting appreciation over the coming months or years. In comparison, a day trader might focus on short-term economic news or technical indicators to make quick trades, and a swing trader might enter a position based on expected price movements over a few weeks.
Finding Opportunities in Position Trading
Identifying Long-Term Trends
Identifying long-term trends is central to successful position trading. This process involves analyzing various economic indicators and market conditions to determine the direction in which a currency pair is likely to move over an extended period. Long-term trends are influenced by a range of factors, including economic growth rates, interest rates, inflation, and geopolitical events.
To identify these trends, traders often start by examining macroeconomic data such as GDP growth, employment figures, and inflation rates. They also consider central bank policies, which can significantly impact currency values. For example, a country with rising interest rates may attract foreign investment, leading to currency appreciation. Conversely, a country with high inflation might see its currency depreciate as its purchasing power declines.
Example: Suppose you are analyzing the USD/JPY pair. If the U.S. economy is experiencing robust growth and higher interest rates compared to Japan, the USD is likely to appreciate against the JPY. By recognizing these long-term economic trends, you can position yourself to benefit from the anticipated currency movements.
Personal Reflection: I remember analyzing a long-term trend in the GBP/USD pair based on economic indicators like the UK’s GDP growth and the Federal Reserve’s interest rate policies. By understanding the broader economic picture, I was able to make informed decisions about when to enter and exit trades, leading to successful outcomes.
The Role of Fundamental Analysis
Fundamental analysis is crucial for position traders, as it provides insights into the economic forces driving currency values. This type of analysis involves examining economic indicators, central bank policies, and geopolitical events to gauge the strength of a currency. Fundamental analysis helps traders understand the broader economic context and make informed decisions about long-term trends.
Key economic indicators include:
- Interest Rates: Higher interest rates often lead to currency appreciation as they attract foreign investment. Conversely, lower interest rates may lead to depreciation.
- Inflation Rates: Low inflation supports currency strength by preserving purchasing power. High inflation can weaken a currency.
- Economic Growth: Strong economic growth typically leads to currency appreciation, while weak growth can lead to depreciation.
- Employment Data: High employment levels signal a strong economy, which can boost currency value.
Example Table:
| Indicator | Effect on Currency Value |
|---|---|
| Interest Rates | Higher rates generally lead to currency appreciation due to increased foreign investment. |
| Inflation Rates | Lower inflation typically supports currency strength by maintaining purchasing power. |
| Economic Growth | Strong growth often leads to currency appreciation as it reflects a healthy economy. |
| Employment Figures | High employment levels suggest economic strength, which can enhance currency value. |
Personal Anecdote: During my trading career, I closely followed central bank meetings and their impact on interest rates. One notable instance was when the European Central Bank announced an interest rate hike. This news led to a significant appreciation of the euro against the dollar, validating the importance of staying informed about central bank policies.
Position Trading Strategies
Carry Trades
Carry trading is a popular strategy in position trading that involves borrowing money in a currency with a low interest rate and investing it in a currency with a higher interest rate. The profit from a carry trade comes from the interest rate differential, known as the “carry.”
How It Works:
- Identify Interest Rates: Look for currencies with a significant difference in interest rates. For instance, if the Australian dollar (AUD) has a higher interest rate compared to the Japanese yen (JPY), it presents an opportunity for a carry trade.
- Execute the Trade: Borrow the currency with the lower interest rate (JPY) and convert it to the currency with the higher interest rate (AUD). This allows you to earn the interest rate differential while potentially benefiting from any currency appreciation.
- Monitor the Position: Keep track of interest rate changes and market conditions to manage your trade effectively. Interest rate decisions by central banks can influence the profitability of carry trades.
Example:
If the Reserve Bank of Australia has an interest rate of 2.00% and the Bank of Japan has a rate of 0.10%, a carry trade would involve borrowing JPY and investing in AUD. The profit would come from the 1.90% interest rate differential, plus any potential appreciation in AUD against JPY.
Carry Trade Table:
| Currency Pair | Borrowed Currency | Invested Currency | Interest Rate Differential |
|---|---|---|---|
| JPY/AUD | JPY | AUD | 1.90% |
| USD/CHF | CHF | USD | 1.25% |
Personal Reflection: I found carry trading to be particularly effective during periods of stable interest rates. One memorable carry trade was with the USD/TRY pair, where the interest rate differential was significant. The trade proved profitable as the interest rate differential was maintained over the trade period.
Trend Trading
Trend trading is a strategy focused on identifying and following long-term trends in the market. This approach involves using technical indicators and chart patterns to confirm trends and make informed trading decisions.
Key Techniques:
- Moving Averages: Moving averages smooth out price data to identify trends. The Simple Moving Average (SMA) and Exponential Moving Average (EMA) are commonly used. A “Golden Cross,” where the 50-day MA crosses above the 200-day MA, signals a potential uptrend. Conversely, a “Death Cross,” where the 50-day MA crosses below the 200-day MA, indicates a potential downtrend.
- Trendlines: Drawing trendlines on charts helps visualize the direction of the market and identify potential reversal points. An upward trendline connects higher lows, while a downward trendline connects lower highs.
Practical Application:
Consider a scenario where the 50-day EMA crosses above the 200-day EMA, signaling a bullish trend. A trend trader would enter a long position, holding it as long as the trend persists. Conversely, if the moving averages cross in the opposite direction, it may be time to exit or take a short position.
Trend Trading Table:
| Indicator | Signal | Action |
|---|---|---|
| Golden Cross | 50-day MA crosses above 200-day MA | Enter a long position |
| Death Cross | 50-day MA crosses below 200-day MA | Exit long or enter a short position |
Personal Anecdote: One of my most successful trades involved using moving averages to identify a strong uptrend in the GBP/USD pair. By entering the trade based on a Golden Cross and holding it through the trend, I was able to capture significant gains.
Range Trading
Range trading is a strategy used when a currency pair is trading within a defined range. Traders buy at the support level and sell at the resistance level, capitalizing on the predictable price oscillations.
How to Implement:
- Identify the Range: Use historical price data to determine the support and resistance levels. The support level is where the price tends to bounce back up, while the resistance level is where the price tends to reverse downward.
- Place Orders: Buy when the price is near the support level and sell when it approaches the resistance level. Stop-loss orders should be placed just outside the range to protect against breakout moves.
- Monitor Price Action: Continuously observe price movements within the range to adjust your orders and manage your trade effectively.
Example:
If the EUR/USD pair has consistently bounced between 1.1000 (support) and 1.1200 (resistance), a range trader would buy near 1.1000 and sell near 1.1200. The key is to recognize when the price is approaching these levels and act accordingly.
Range Trading Table:
| Currency Pair | Support Level | Resistance Level | Trading Action |
|---|---|---|---|
| EUR/USD | 1.1000 | 1.1200 | Buy near support, sell near resistance |
Personal Experience: I remember trading within a well-defined range in the AUD/JPY pair. By accurately identifying the support and resistance levels and placing my trades accordingly, I was able to achieve consistent results. However, I also learned the importance of being cautious of potential breakouts that could disrupt the range.
Pullback Trading
Pullback trading involves capitalizing on temporary price dips or rallies within a longer-term trend. Traders use these temporary movements to enter trades at favorable prices during the trend’s correction phases.
How to Execute:
- Identify the Trend: Determine the direction of the primary trend, whether up or down.
- Wait for a Pullback: Look for short-term price movements against the trend. In an uptrend, this means waiting for the price to dip before buying. In a downtrend, it involves waiting for a price rally before selling.
- Enter the Trade: Buy when the price pulls back to a key support level in an uptrend or sell when it rallies to a key resistance level in a downtrend.
Example:
If you are trading in an uptrend and the price of USD/JPY pulls back to a significant support level, you might consider buying at this lower price point, anticipating that the trend will resume upward.
Pullback Trading Table:
| Trend Direction | Pullback Action | Trading Strategy |
|---|---|---|
| Uptrend | Buy on price dip | Buy when the price temporarily drops during an uptrend. |
| Downtrend | Sell on price rally | Sell when the price temporarily rises during a downtrend. |
Personal Insight: I recall using pullback trading during a strong uptrend in the USD/CHF pair. By waiting for the price to pull back to a key support level and then entering a buy order, I was able to capitalize on the subsequent trend continuation.
Managing Risks in Position Trading
Importance of Risk Management
Risk management is critical in position trading, given the extended holding periods and the potential for significant market fluctuations. Effective risk management strategies help protect your capital and ensure that losses are manageable.
Key Components:
- Stop-Loss Orders: Stop-loss orders are essential for limiting potential losses. A stop-loss order automatically closes a trade when the price reaches a predetermined level. This helps prevent large losses and keeps your trading capital intact.
- Position Sizing: Proper position sizing involves determining the appropriate amount of capital to allocate to each trade. This helps manage risk and ensures that no single trade can significantly impact your overall portfolio.
- Diversification: Diversifying your positions across different currency pairs or asset classes can reduce risk. By spreading your investments, you minimize the impact of adverse movements in any single currency pair.
Personal Reflection: One lesson I learned the hard way was the importance of not risking too much on a single trade. Early in my trading career, I took large positions without proper risk management, which led to substantial losses. Implementing strict stop-loss orders and maintaining proper position sizing were crucial in safeguarding my trading capital.
Setting Stop-Loss Orders
Stop-loss orders are a fundamental tool for managing risk. They automatically close a trade when the price reaches a specified level, helping to limit potential losses. Stop-loss orders are particularly important in position trading due to the long-term nature of the trades and the potential for significant price fluctuations.
Types of Stop-Loss Orders:
- Fixed Stop-Loss: A fixed stop-loss order is set at a specific price level, regardless of market conditions. For example, if you enter a long position in EUR/USD at 1.1500, you might set a fixed stop-loss at 1.1400. This means your position will be closed if the price falls to 1.1400.
- Trailing Stop-Loss: A trailing stop-loss order adjusts automatically as the price moves in your favor. For example, if you set a trailing stop-loss of 100 pips and the price rises by 150 pips, the stop-loss will move up to lock in profits while still allowing for further gains.
Example:
If you enter a long position in USD/JPY at 110.00 and set a fixed stop-loss at 109.50, your trade will be automatically closed if the price falls to 109.50. Alternatively, a trailing stop-loss could be set at 50 pips below the current price, allowing you to capture profits as the price rises.
Stop-Loss Table:
| Stop-Loss Type | Description | Example |
|---|---|---|
| Fixed Stop-Loss | Set at a specific price level. | Buy EUR/USD at 1.1500, stop-loss at 1.1400. |
| Trailing Stop-Loss | Adjusts automatically as the price moves in your favor. | Buy USD/JPY at 110.00, trailing stop-loss at 50 pips below current price. |
Personal Anecdote: I once used a trailing stop-loss during a strong uptrend in the AUD/NZD pair. As the price moved in my favor, the trailing stop-loss helped lock in profits while allowing the position to remain open for further gains. It was a valuable tool in managing the trade effectively.
Position Sizing and Diversification
Position sizing is the process of determining the amount of capital to allocate to each trade, and it plays a crucial role in managing risk. Proper position sizing ensures that no single trade can cause substantial damage to your overall portfolio. Diversification, on the other hand, involves spreading investments across different currency pairs or asset classes to reduce risk.
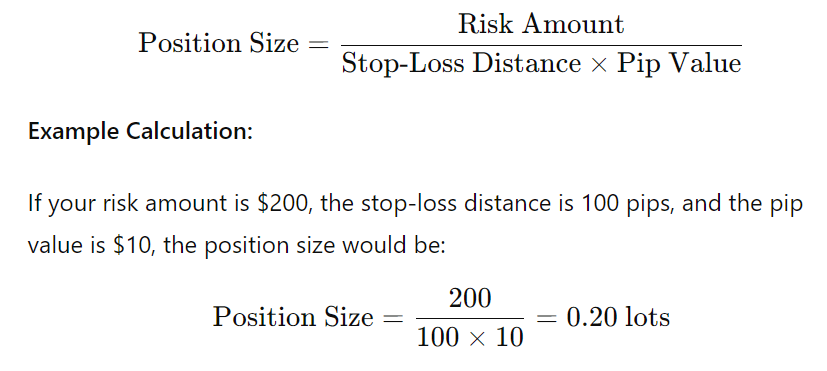
How to Calculate Position Size:
- Determine Your Risk Tolerance: Decide the percentage of your capital you are willing to risk on a single trade. For example, if you are comfortable risking 2% of your $10,000 account, your risk per trade would be $200.
- Calculate the Stop-Loss Distance: Measure the distance between your entry price and stop-loss level in pips. For example, if you enter a trade at 1.2000 and set a stop-loss at 1.1900, the stop-loss distance is 100 pips.
- Determine Position Size: Use the following formula to calculate position size:
Diversification:
Diversification involves spreading your investments across different currency pairs or asset classes to mitigate risk. By diversifying, you reduce the impact of adverse movements in any single position. This strategy helps protect your overall portfolio from significant losses.
Example:
If you usually trade USD/JPY and EUR/USD, consider adding other pairs like GBP/USD or AUD/USD to your portfolio. This way, if one currency pair experiences a downturn, the others may perform well, balancing your overall risk.
Diversification Table:
| Currency Pair | Role in Portfolio |
|---|---|
| USD/JPY | Major currency pair |
| EUR/USD | Major currency pair |
| GBP/USD | Diversification against other pairs |
| AUD/USD | Diversification against other pairs |
Personal Insight: I’ve found diversification to be a key element in managing risk. By trading a variety of currency pairs and not putting all my capital into one trade, I was able to better weather market volatility and protect my overall portfolio.
Tools and Resources for Position Trading
Technical Analysis Tools
Technical analysis tools help position traders analyze historical price data and identify trends. These tools include chart patterns, technical indicators, and various types of charts. They play a vital role in confirming trade setups and making informed decisions.
Popular Technical Indicators:
- Moving Averages: Moving averages smooth out price data to identify trends. The SMA and EMA are widely used to track long-term trends and potential entry and exit points.
- Relative Strength Index (RSI): The RSI measures the speed and change of price movements. It ranges from 0 to 100 and is used to identify overbought or oversold conditions. An RSI above 70 suggests overbought conditions, while an RSI below 30 indicates oversold conditions.
- Bollinger Bands: Bollinger Bands consist of a middle band (SMA) and two outer bands that represent standard deviations from the SMA. The bands expand and contract based on market volatility, helping traders identify potential breakouts or reversals.
Technical Analysis Table:
| Indicator | Purpose | Example Application |
|---|---|---|
| Moving Averages | Identify trends and potential entry/exit points | Use 50-day and 200-day MA for long-term trend analysis. |
| RSI | Identify overbought or oversold conditions | Buy when RSI is below 30, sell when RSI is above 70. |
| Bollinger Bands | Measure market volatility and identify potential breakouts | Trade when the price approaches the outer bands. |
Personal Reflection: I have found that combining multiple technical indicators provides a more comprehensive view of the market. For example, using moving averages in conjunction with RSI helped me better identify trend reversals and potential entry points.
Fundamental Analysis Resources
Fundamental analysis resources provide valuable information on economic indicators, central bank policies, and geopolitical events. These resources help position traders understand the broader economic context and make informed decisions.
Key Resources:
- Economic Calendars: Economic calendars track important economic events and data releases, such as GDP reports, employment figures, and central bank meetings. These calendars help traders anticipate market-moving events and plan their trades accordingly.
- Central Bank Reports: Central bank reports and statements provide insights into monetary policy decisions, interest rate changes, and economic outlooks. Monitoring these reports helps traders understand the potential impact on currency values.
- News Outlets: Financial news outlets and economic analysis websites offer real-time updates on market events, geopolitical developments, and economic trends. Staying informed about current events helps traders anticipate market movements and adjust their strategies.
Example Table:
| Resource | Purpose | Example Source |
|---|---|---|
| Economic Calendars | Track economic events and data releases | Investing.com Economic Calendar |
| Central Bank Reports | Provide insights into monetary policy | Federal Reserve Board, ECB Press Releases |
| News Outlets | Provide real-time market updates | Bloomberg, Reuters |
Personal Anecdote: I vividly remember how monitoring economic calendars and central bank reports helped me stay ahead of major market moves. For instance, anticipating an interest rate hike from the Federal Reserve allowed me to position myself advantageously in the forex market.
FAQs
Position trading is a long-term trading strategy where traders hold positions for weeks, months, or even years to capitalize on significant market trends. Unlike day trading or swing trading, which focus on short-term price movements, position trading emphasizes fundamental analysis to understand broader economic trends. Traders aim to profit from substantial, sustained movements in currency pairs, requiring patience and a strong grasp of economic factors that influence market trends.
Position trading differs from day trading and swing trading primarily in its timeframe and focus. Day trading involves executing multiple trades within a single day to exploit short-term price fluctuations, while swing trading holds positions for several days to weeks to capture shorter-term trends. Position trading, on the other hand, involves holding trades for extended periods based on long-term economic and market trends, requiring a focus on fundamental analysis rather than short-term price movements.
The main benefits of position trading include the potential for substantial profits from long-term market trends and reduced transaction costs due to fewer trades. Traders can avoid the stress and time commitment associated with frequent trading. Additionally, position trading allows traders to benefit from significant market movements and trends that may not be visible in shorter-term trading strategies.
Position trading carries risks such as exposure to long-term market volatility and potential large swings in currency prices. Traders must be prepared for significant fluctuations and have the emotional resilience to manage the stress of holding positions over extended periods. Additionally, over-leveraging can lead to substantial losses, and the capital tied up in long-term positions may miss out on other profitable opportunities.
Position traders find opportunities primarily through fundamental analysis, which involves evaluating economic indicators, interest rates, geopolitical events, and other macroeconomic factors that can impact currency values over the long term. Technical analysis may also be used to identify entry and exit points within the context of the broader economic trends.
Common strategies in position trading include carry trading, where traders exploit interest rate differentials between currencies; trend trading, which involves following long-term market trends using indicators like moving averages; and pullback trading, which focuses on entering positions during temporary retracements within a prevailing trend. Each strategy relies on both fundamental and technical analysis to make informed decisions.
Essential tools for position traders include technical indicators such as moving averages and RSI (Relative Strength Index) to analyze market trends and potential entry/exit points. Economic calendars provide insights into upcoming economic events and data releases that could impact currency values. Additionally, news feeds and central bank reports help traders stay informed about economic conditions and policy changes.
Risk management is crucial in position trading due to the extended holding periods and potential for significant market fluctuations. Effective risk management practices include setting stop-loss orders to limit potential losses, using appropriate position sizing to manage risk per trade, and diversifying positions across different currency pairs to reduce overall portfolio risk.
Beginners can succeed with position trading if they are willing to invest time in learning the fundamentals of forex trading and developing a solid trading plan. It’s important for beginners to understand fundamental and technical analysis, choose a reliable broker, and start with a small trading account to gain experience before scaling up. Patience and discipline are key traits for success in position trading.
Common mistakes to avoid in position trading include over-leveraging, which can amplify losses; ignoring fundamental analysis, which can lead to poor trading decisions; and lacking patience, which can result in closing positions too early and missing out on long-term gains. Additionally, inadequate risk management practices, such as failing to set stop-loss orders or not diversifying, can jeopardize trading capital and overall success.
Conclusion
Position trading in forex offers a strategic approach for those willing to take a long-term view and navigate through broader economic trends. By understanding the fundamentals of position trading, implementing effective strategies, and managing risks, traders can benefit from significant market movements over time. Combining technical and fundamental analysis, utilizing appropriate tools, and staying informed about market developments are crucial for success in position trading.
Final Thoughts: As you embark on your position trading journey, remember that patience and discipline are key. Embrace the long-term nature of this strategy and continuously refine your skills and knowledge. By doing so, you can position yourself to take advantage of major forex market trends and achieve your trading goals.


 Central Banks' Role in Forex Markets forixo.trade
Leave a Reply
Want to join the discussion?Feel free to contribute!