
Relative Strength Index (RSI) Indicator
The Relative Strength Index (RSI) is one of the most widely used technical analysis indicators. Developed by J. Welles Wilder Jr. in 1978, the RSI is a momentum oscillator that measures the speed and magnitude of a security’s recent price movements. Traders and investors use the RSI to identify overbought or oversold conditions in the market, making it a critical tool for anticipating potential trend reversals and optimizing entry and exit points for trades. The RSI is calculated on a scale from 0 to 100, with higher values indicating potential overbought conditions and lower values indicating possible oversold conditions.
At its core, the RSI provides insight into the momentum of price changes, reflecting the strength of bullish or bearish forces at any given time. This indicator is highly regarded for its simplicity and effectiveness across multiple asset classes, including stocks, commodities, forex, and cryptocurrencies. When properly understood and applied, the RSI can offer significant advantages to traders by helping them detect trend weaknesses or potential reversals before they become evident through price action alone. The RSI also integrates well with other technical analysis tools, further enhancing its versatility and value in trading strategies.
Contents
- How the Relative Strength Index (RSI) Works
- Calculating the RSI
- Interpreting the RSI Indicator
- RSI in Different Market Environments
- RSI Trading Strategies
- Limitations of the RSI
- RSI vs. Other Momentum Indicators
- RSI in Different Financial Markets
- Case Studies and Examples
- Optimizing RSI for Personal Trading
- The Future of RSI in Algorithmic Trading
- FAQs
How the Relative Strength Index (RSI) Works
Understanding Momentum in Price Movements
The Relative Strength Index (RSI) functions as a momentum oscillator, quantifying the intensity of price movements over a specified time frame. Momentum is essentially the rate of acceleration in a security’s price, and it provides traders with critical insights into the underlying strength or weakness of a trend. By analyzing the upswings and downswings in prices, the RSI helps traders understand whether buying or selling pressure is dominant in the market at a particular moment.
The RSI measures the ratio of upward price movements to downward price movements within a given period, typically 14 days. The resulting value is plotted on a scale of 0 to 100. Higher values suggest that the market is experiencing strong buying momentum, potentially leading to an overbought condition. Conversely, lower values indicate selling momentum, possibly signaling oversold conditions. This makes the RSI particularly valuable for identifying potential trend reversals or corrections in the price trajectory.
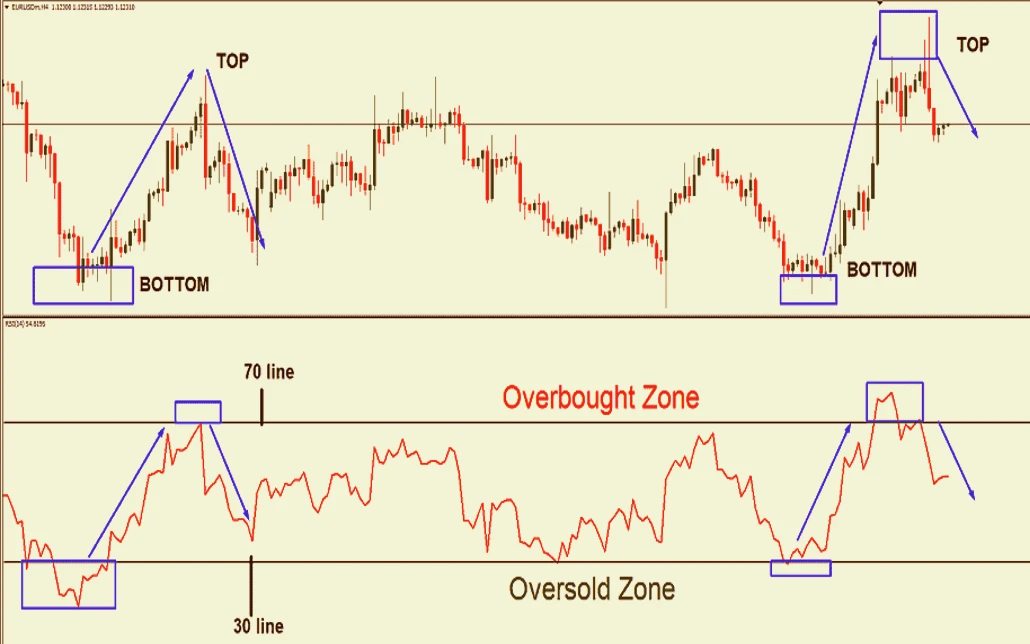
Importance of Overbought and Oversold Conditions
One of the primary reasons traders rely on the RSI is to detect overbought or oversold conditions in the market. When the RSI reaches or exceeds 70, it indicates that the market may be overbought, and traders may begin to anticipate a potential price correction or reversal. Conversely, when the RSI dips below 30, the market is considered oversold, signaling the potential for a bullish reversal.
It is important to note that the RSI’s overbought and oversold thresholds are not definitive signals of immediate price reversals. Instead, they highlight situations where price movements may be nearing exhaustion. Traders typically combine RSI signals with other technical indicators or chart patterns to confirm potential turning points in the market. For instance, a trader might wait for the RSI to drop back below 70 after hitting overbought levels before selling or might use trendlines to assess whether the market is likely to reverse direction.
RSI’s Role in Identifying Trend Strength and Weakness
Another valuable feature of the RSI is its ability to provide traders with insights into the strength or weakness of a prevailing trend. During strong bullish trends, the RSI may remain elevated for extended periods without necessarily signaling an imminent price reversal. Similarly, during bearish trends, the RSI may remain low for prolonged periods. This reflects the concept that markets can remain overbought or oversold for significant lengths of time when strong trends are in place.
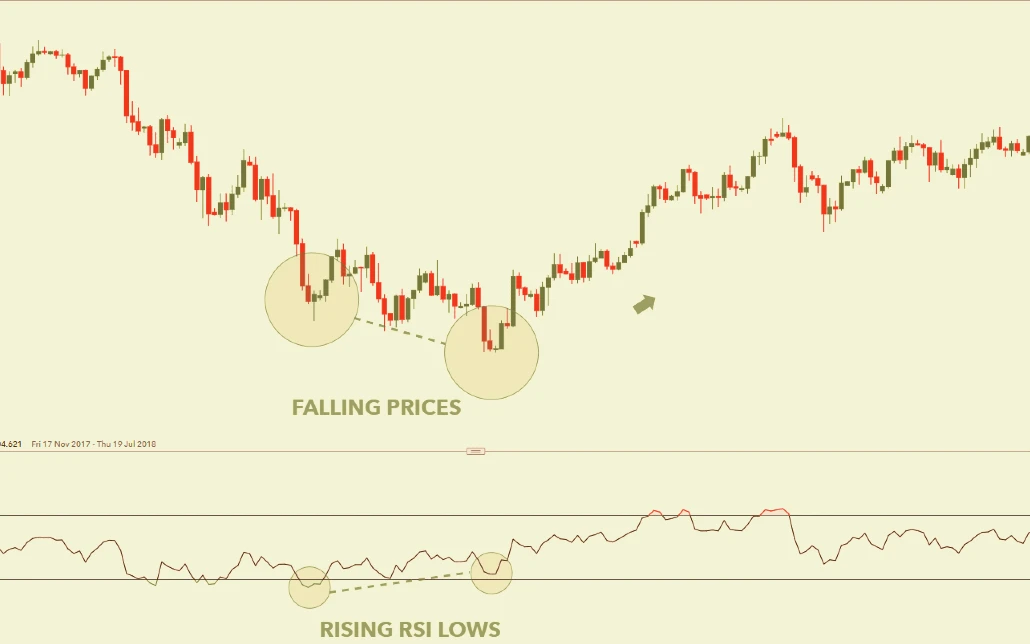
Traders often look for divergence between price movements and the RSI to assess potential trend reversals. Bullish divergence occurs when the RSI forms higher lows while the price forms lower lows, indicating that downward momentum is weakening. Conversely, bearish divergence occurs when the RSI forms lower highs while the price forms higher highs, signaling a possible weakening of upward momentum. Such divergences often serve as early indicators of impending trend reversals, providing traders with valuable information to adjust their positions.
Calculating the RSI
Formula Breakdown
The calculation of the RSI is based on the ratio of average gains to average losses over a specific period, typically 14 days. The RSI formula consists of two key steps:
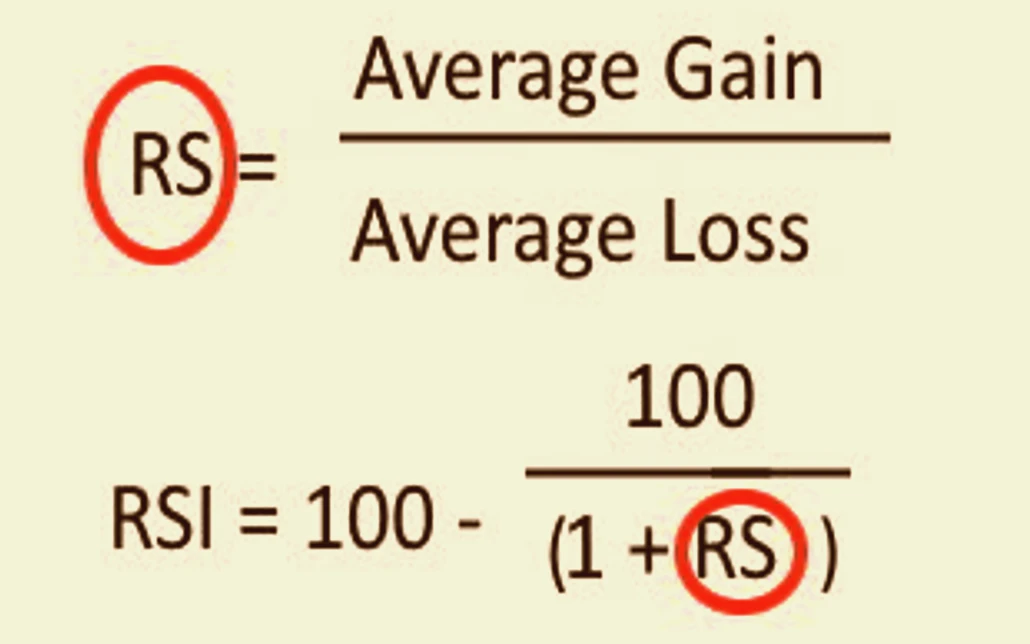
- Step 1: Calculate the Relative Strength (RS):
- RS = (Average Gain over the period) / (Average Loss over the period)
- The average gain and loss are calculated by summing the gains and losses over the selected period and dividing by the number of periods.
- Step 2: Calculate the RSI:
- RSI = 100 – [100 / (1 + RS)]
- This formula converts the relative strength into a scale from 0 to 100, where higher values indicate stronger bullish momentum and lower values indicate stronger bearish momentum.
To illustrate this with an example, consider a stock that has experienced price increases on seven of the past 14 days, with an average gain of 1%. On the remaining seven days, the stock has experienced an average loss of 0.8%. The relative strength would be calculated as:
- RS = 1% / 0.8% = 1.25
Using the RSI formula, the calculation would be:
- RSI = 100 – [100 / (1 + 1.25)] = 100 – [100 / 2.25] = 100 – 44.44 = 55.56
Worked Examples for Different Time Frames
The standard look-back period for calculating the RSI is 14 periods, but traders can adjust this timeframe depending on their trading strategy. For example, a shorter look-back period (e.g., 7 periods) will produce a more sensitive RSI, reacting quickly to price changes. This may be useful for short-term traders looking for quick signals but may result in more false positives. Conversely, using a longer period (e.g., 21 periods) produces a more stable RSI that is less responsive to minor price fluctuations but may miss shorter-term opportunities.
In the following table, you can see how the RSI calculation differs for different look-back periods, using hypothetical data for price gains and losses:
| Time Period (Days) | Average Gain (%) | Average Loss (%) | Relative Strength (RS) | RSI Value |
|---|---|---|---|---|
| 7 Days | 1.2 | 0.8 | 1.50 | 60.00 |
| 14 Days | 1.0 | 0.8 | 1.25 | 55.56 |
| 21 Days | 0.9 | 0.7 | 1.29 | 56.34 |
Interpreting the RSI Indicator
Overbought and Oversold Conditions
The RSI’s primary function is to indicate overbought and oversold conditions, which can be interpreted as potential signals for trend reversals. However, these thresholds (30 for oversold and 70 for overbought) are not absolute and can vary depending on the asset and market conditions. In strong bull markets, the RSI may stay above 70 for extended periods without a significant price correction. Similarly, in bear markets, the RSI may remain below 30 for prolonged periods.
Advanced traders often adjust these levels to better reflect the prevailing market environment. For instance, in a strong uptrend, an RSI level of 80 might be more appropriate as an overbought threshold, while in a downtrend, a level of 20 might be more suitable for identifying oversold conditions. This flexibility allows the RSI to be tailored to different trading strategies and market conditions, enhancing its effectiveness as a trading tool.
Divergence and Its Importance
Divergence between the RSI and price action is one of the most powerful signals provided by this indicator. Divergence occurs when the direction of the RSI does not match the direction of the price. For example, if the price is making higher highs while the RSI is making lower highs, this is known as bearish divergence and can signal a potential downward reversal in price. Conversely, if the price is making lower lows while the RSI is making higher lows, this is known as bullish divergence and may indicate an upcoming upward reversal.
Divergence is particularly useful in identifying the weakening of a trend. However, not all divergences lead to reversals, and some can occur in the context of a strong trend, resulting in a temporary price correction rather than a full reversal. Therefore, it is crucial to use divergence in conjunction with other technical indicators or chart patterns to increase the reliability of the signals.
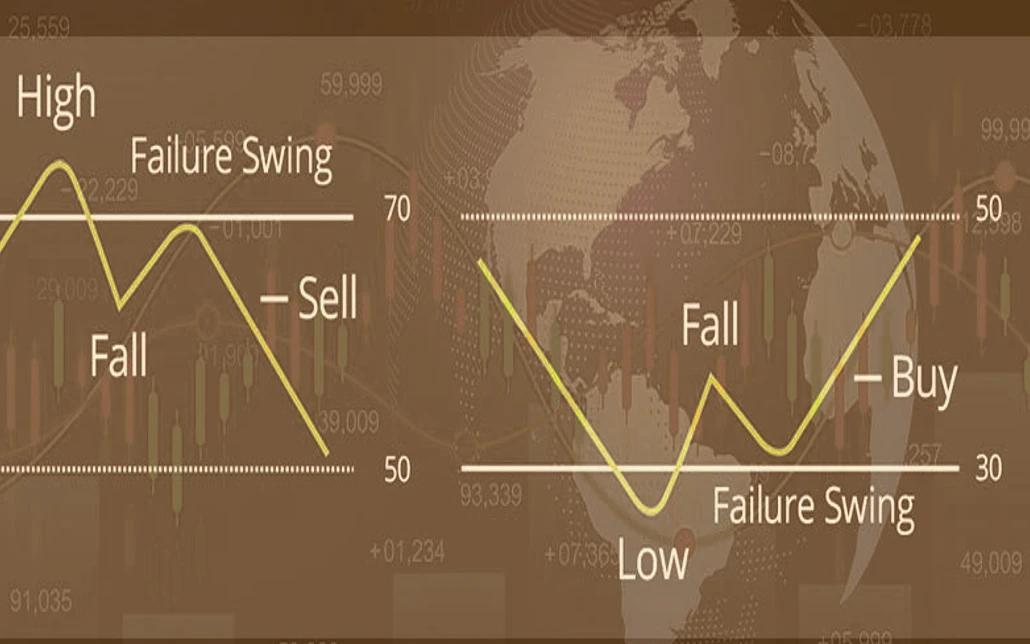
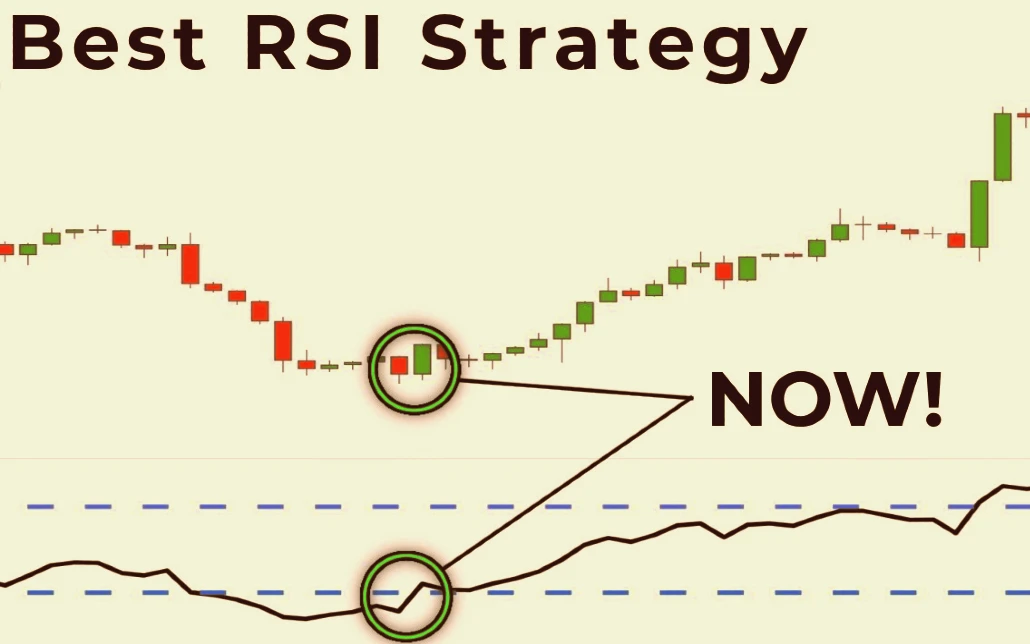
RSI Swing Rejections
Another technique for interpreting RSI is the swing rejection, which provides additional insight into potential reversals. A bullish swing rejection involves the following steps:
- The RSI drops into oversold territory (below 30).
- The RSI crosses back above 30.
- The RSI dips again but stays above the oversold level.
- The RSI then breaks its previous high.
This pattern indicates a strengthening bullish momentum and can be used as a buy signal. Conversely, a bearish swing rejection occurs when:
- The RSI rises into overbought territory (above 70).
- The RSI crosses back below 70.
- The RSI rises again but stays below the overbought level.
- The RSI then breaks its previous low.
This pattern suggests weakening bullish momentum and can be used as a sell signal.
RSI in Different Market Environments
RSI in Trading Ranges vs. Trending Markets
The effectiveness of the RSI can vary significantly depending on whether the market is trending or range-bound. In trading ranges, the RSI is highly effective at identifying overbought and oversold conditions, as the price tends to oscillate between support and resistance levels. In this environment, traders can use the RSI to time their entries and exits with greater accuracy, buying when the RSI signals oversold conditions and selling when it indicates overbought conditions.
In trending markets, however, the RSI’s traditional thresholds of 30 and 70 may produce misleading signals. In a strong uptrend, for example, the RSI may remain in overbought territory for an extended period without a significant price correction. Conversely, in a strong downtrend, the RSI may stay in oversold territory for a prolonged time. To address this, traders can modify the RSI’s thresholds to better reflect the strength of the trend or use the RSI in conjunction with trend-following indicators such as moving averages to improve the reliability of the signals.
Adapting RSI for Various Asset Classes
The RSI’s versatility allows it to be applied across different asset classes, including stocks, forex, commodities, and cryptocurrencies. However, each asset class may require different RSI settings or interpretations. For example, the volatility of forex markets often leads traders to use shorter RSI periods, such as 7 or 9 days, to capture quick price movements. In contrast, stock traders may prefer the standard 14-day period to smooth out short-term fluctuations and focus on medium-term trends.
Cryptocurrencies, known for their high volatility, may also benefit from shorter RSI periods or adjusted thresholds. Since crypto assets can experience rapid price movements, traders might find it useful to lower the overbought threshold to 60 or raise the oversold threshold to 40, making the RSI more responsive to sudden market changes. Adapting the RSI to the specific characteristics of each asset class ensures that traders can maximize the indicator’s effectiveness across different markets.
Modifying RSI for Different Timeframes
The RSI can be customized for different trading timeframes, from intraday to long-term analysis. Short-term traders, such as day traders and scalpers, often use a shorter RSI period (e.g., 5 or 7 periods) to capture quick price movements and generate more signals. This approach is useful in fast-moving markets where traders need to make rapid decisions.
Long-term investors, on the other hand, may use longer RSI periods (e.g., 21 or 30 periods) to reduce noise and focus on more significant price trends. This approach helps investors avoid overtrading and concentrate on the broader market direction. Additionally, long-term RSI analysis can be combined with other indicators, such as moving averages or trendlines, to enhance the accuracy of signals.
RSI Trading Strategies
Basic RSI Trading Rules
The most basic RSI trading strategy involves buying when the RSI crosses above the oversold threshold (30) and selling when it crosses below the overbought threshold (70). This approach is straightforward and can be effective in range-bound markets where prices tend to oscillate between support and resistance levels. However, in trending markets, this strategy may generate false signals, leading to premature entries or exits.
To improve the reliability of this strategy, traders can combine the RSI with other technical indicators or chart patterns. For example, they might use moving averages to confirm the trend direction or look for candlestick patterns, such as dojis or hammers, that signal potential reversals. By using the RSI in conjunction with other tools, traders can filter out false signals and increase their chances of success.
Combining RSI with Other Indicators
One of the most effective ways to enhance RSI trading strategies is to combine the RSI with other technical indicators. Moving averages, for example, can help confirm the direction of the trend and reduce the likelihood of false signals. A common approach is to use the RSI in conjunction with the 50-day moving average. When the RSI signals an overbought condition and the price is below the 50-day moving average, this may confirm a bearish trend and provide a stronger sell signal.
Another popular combination is the RSI with the Moving Average Convergence Divergence (MACD) indicator. The MACD provides additional insights into the momentum and strength of the trend, and when both the RSI and MACD generate similar signals, the probability of a successful trade increases. For instance, if the RSI indicates an oversold condition and the MACD shows a bullish crossover, this could be a strong buy signal.
Advanced RSI Trading Techniques
For more experienced traders, advanced RSI techniques can offer greater precision and profitability. One such technique is the use of RSI divergence, where the RSI moves in the opposite direction of the price. As mentioned earlier, bullish divergence occurs when the RSI forms higher lows while the price forms lower lows, signaling weakening bearish momentum and a potential upward reversal. Bearish divergence, on the other hand, occurs when the RSI forms lower highs while the price forms higher highs, indicating weakening bullish momentum and a possible downward reversal.
Another advanced technique is the RSI swing rejection, which involves analyzing the RSI’s behavior when it reenters the overbought or oversold territory. This method can provide early signals of potential reversals, allowing traders to enter or exit positions before the broader market reacts.
Limitations of the RSI
Common Pitfalls and False Signals
While the RSI is a powerful tool, it is not without its limitations. One of the most common pitfalls is the occurrence of false signals, particularly in trending markets. In such conditions, the RSI may remain in overbought or oversold territory for extended periods, leading traders to prematurely exit profitable positions or enter trades that do not perform well. This issue highlights the importance of using the RSI in conjunction with other technical indicators and considering the broader market context.
Another limitation is the potential for over-optimization. Traders may be tempted to adjust the RSI settings to fit historical data, creating a model that works well in the past but fails in real-time trading. This phenomenon, known as curve-fitting, can lead to unreliable signals and poor trading performance. To avoid this, traders should use RSI settings that are widely accepted and proven across different market conditions.
Situations Where RSI May Fail
The RSI is most effective in markets with clear trading ranges or when used to confirm the strength of a trend. However, in markets characterized by strong, unidirectional trends, the RSI may fail to provide accurate signals. For example, during a strong bull market, the RSI might stay in overbought territory for long periods without a significant price correction, leading traders to miss out on potential gains.
Additionally, the RSI may struggle in highly volatile markets where price movements are erratic and unpredictable. In such environments, the RSI’s signals can be inconsistent, leading to frequent whipsaws and trading losses. Traders should be cautious when using the RSI in these situations and consider using additional tools to filter out noise and improve the reliability of their signals.
Avoiding RSI Misinterpretations
To avoid misinterpreting RSI signals, traders should always consider the broader market context and use the RSI in conjunction with other technical indicators. For example, a high RSI reading does not always mean that a security is overbought and due for a correction. In strong uptrends, the RSI can remain elevated for extended periods as buying pressure continues to drive prices higher. In these cases, traders should look for additional confirmation, such as trendline breaks or moving average crossovers, before making trading decisions.
Moreover, traders should be aware that RSI signals can vary depending on the time frame used. For example, a stock might show overbought conditions on a daily chart but appear neutral or even oversold on a weekly chart. This discrepancy can lead to conflicting signals and potentially misguided trading decisions. Therefore, it’s essential to analyze RSI readings across multiple time frames to gain a more comprehensive understanding of the market dynamics.
RSI vs. Other Momentum Indicators
Comparing RSI with MACD
The Relative Strength Index (RSI) and the Moving Average Convergence Divergence (MACD) are two of the most popular momentum indicators used in technical analysis. While both aim to identify momentum and potential trend reversals, they do so in different ways, offering unique insights that can complement each other.
The RSI measures the speed and change of price movements by comparing the magnitude of recent gains to recent losses over a specified period, usually 14 periods. This indicator is particularly useful for identifying overbought and oversold conditions, providing traders with potential buy or sell signals.
On the other hand, the MACD is a trend-following momentum indicator that shows the relationship between two moving averages of a security’s price—typically the 12-period and 26-period Exponential Moving Averages (EMAs). The MACD line is calculated by subtracting the 26-period EMA from the 12-period EMA, and a signal line, which is a 9-period EMA of the MACD line, is plotted alongside. When the MACD crosses above the signal line, it’s considered a bullish signal, and when it crosses below, it’s seen as bearish.
One of the key differences between the RSI and MACD is that while the RSI is bounded between 0 and 100, providing clear thresholds for overbought and oversold conditions, the MACD is unbounded, making its signals more dependent on relative price action. Because of these differences, many traders use the RSI and MACD together to gain a more comprehensive view of market conditions. For example, when both the RSI signals oversold and the MACD shows a bullish crossover, the probability of a successful trade increases.
RSI vs. Stochastic Oscillator
The Stochastic Oscillator is another momentum indicator that compares a security’s closing price to its price range over a specified period, typically 14 days. Like the RSI, it oscillates between 0 and 100, with readings above 80 indicating overbought conditions and readings below 20 indicating oversold conditions.
The primary difference between the RSI and the Stochastic Oscillator lies in their calculation and interpretation. The RSI measures the velocity of price movements by comparing recent gains to recent losses, while the Stochastic Oscillator focuses on the closing price’s position relative to the price range over a set period. This means that the Stochastic Oscillator is more sensitive to recent price changes, often leading to more frequent signals.
Traders who prefer to capture short-term price movements may find the Stochastic Oscillator more useful due to its higher sensitivity. However, this also means that it may generate more false signals in choppy markets. The RSI, with its smoother calculations, may be better suited for identifying longer-term momentum shifts. When used together, these indicators can provide complementary insights, with the Stochastic Oscillator offering more immediate signals and the RSI providing confirmation of broader trends.
RSI vs. Moving Averages
Moving averages, including Simple Moving Averages (SMA) and Exponential Moving Averages (EMA), are among the most basic yet powerful tools in technical analysis. They smooth out price data to identify the direction of the trend and can serve as dynamic support and resistance levels.
While the RSI is an oscillator that provides momentum signals, moving averages focus solely on the trend direction by averaging past price data. One of the key advantages of moving averages is their ability to filter out noise from price data, making them particularly useful in trending markets. For example, a crossover strategy involving the 50-day and 200-day moving averages is a classic method to identify long-term trend reversals.
However, moving averages lag behind the market because they rely on historical data. The RSI, being more responsive to recent price movements, can offer earlier signals of potential trend reversals or overbought/oversold conditions. When used together, moving averages can confirm the direction of the trend, while the RSI can help fine-tune entry and exit points by signaling when a trend is potentially overextended.
RSI in Different Financial Markets
RSI in Forex Trading
The Forex market, known for its high volatility and liquidity, is particularly well-suited to the application of the RSI. Forex traders often use the RSI to identify overbought and oversold currency pairs, aiming to enter or exit trades at optimal points. Given the 24-hour nature of Forex markets and the frequent price fluctuations, the RSI’s ability to provide timely signals makes it a valuable tool for Forex traders.
In Forex trading, the standard 14-period RSI is often shortened to 9 or even 7 periods to capture quicker price movements. This adjustment makes the RSI more sensitive to short-term trends, which is crucial in a market where currency pairs can experience rapid price changes due to economic data releases, geopolitical events, or central bank interventions.
For instance, a Forex trader might observe that the EUR/USD pair’s RSI has dropped below 30, signaling that the pair may be oversold. However, instead of entering a long position immediately, the trader might wait for the RSI to cross back above 30, or combine the RSI signal with confirmation from other indicators, such as the MACD or Bollinger Bands, to increase the likelihood of a successful trade.
Using RSI for Stock Analysis
In the stock market, the RSI is widely used by traders and investors to assess individual stocks, sectors, and indices. Its ability to highlight overbought or oversold conditions makes it an essential tool for identifying potential buying opportunities during market corrections or selling points during rallies.
For example, during a bull market, a stock might show an RSI reading above 70, indicating that it is overbought. Traders might use this as a signal to take profits or to consider shorting the stock if they expect a price pullback. Conversely, in a bear market, a stock with an RSI below 30 might be considered oversold, prompting traders to look for buying opportunities if they believe the stock is due for a rebound.
The RSI can also be applied to broader indices, such as the S&P 500, to gauge overall market sentiment. A high RSI reading on an index might indicate that the market as a whole is overbought, suggesting that a correction could be imminent. On the other hand, an oversold RSI reading might indicate that the market is undervalued and poised for a recovery.
RSI and Cryptocurrency Markets
The cryptocurrency market is known for its extreme volatility, making technical analysis tools like the RSI particularly valuable. Due to the rapid price movements and 24/7 nature of cryptocurrency trading, the RSI can provide crucial insights into market sentiment and help traders capitalize on short-term opportunities.
In crypto trading, traders often adjust the standard 14-period RSI to shorter periods, such as 7 or 9, to better capture the quick price swings characteristic of cryptocurrencies. For example, a trader might use a 7-period RSI to identify when Bitcoin is overbought and due for a correction, or when it is oversold and ready for a rebound.
However, due to the high volatility of cryptocurrencies, RSI signals should be used with caution. In many cases, RSI readings can remain in overbought or oversold territory for extended periods, especially during strong bullish or bearish trends. To mitigate this risk, crypto traders often combine RSI signals with other technical indicators, such as moving averages, volume analysis, or Fibonacci retracement levels, to enhance the reliability of their trading strategies.
Case Studies and Examples
Historical Examples of RSI Success
To illustrate the effectiveness of the RSI, consider the case of Apple Inc. (AAPL) during the 2009-2012 bull market. Throughout this period, Apple’s stock experienced significant price appreciation, and the RSI was instrumental in identifying both buying and selling opportunities.
For instance, in early 2012, Apple’s RSI repeatedly touched the overbought level of 70, signaling that the stock might be overextended. Traders who heeded this signal and took profits were able to avoid the subsequent price correction that occurred later that year. Conversely, in mid-2011, when Apple’s RSI dipped below 30, it signaled an oversold condition. Traders who bought the stock during this period enjoyed substantial gains as Apple’s stock price rebounded strongly in the following months.
This case study demonstrates the RSI’s utility in identifying key turning points in a stock’s price trajectory, helping traders make informed decisions about when to enter or exit positions.
When RSI Failed: Lessons from the Past
While the RSI is a powerful tool, it is not infallible, and there have been instances where RSI signals have led to unsuccessful trades. One notable example is the 2017 Bitcoin rally. During this period, Bitcoin’s RSI remained in overbought territory for an extended time, repeatedly exceeding the 70 level as the price continued to soar.
Traders who relied solely on the RSI to short Bitcoin based on overbought signals faced significant losses as the cryptocurrency continued to defy traditional technical analysis principles. The lesson here is that in highly speculative markets, such as cryptocurrencies, the RSI may not always provide accurate signals, particularly during periods of irrational exuberance or panic selling.
To avoid such pitfalls, traders should always use the RSI in conjunction with other technical indicators and consider the broader market context. In the case of the 2017 Bitcoin rally, traders who combined RSI signals with trend-following indicators, such as moving averages, might have been better equipped to navigate the market’s extreme volatility.
Real-World RSI Divergence Case Study
RSI divergence is a powerful signal that can indicate a potential reversal in the price trend. A notable example of RSI divergence occurred in the S&P 500 index during the 2008 financial crisis. In late 2008, as the S&P 500 continued to make lower lows, the RSI began to make higher lows, signaling bullish divergence.
This divergence suggested that although the index was still declining, the downward momentum was weakening, indicating a potential reversal. Traders who recognized this divergence and positioned themselves accordingly were able to capitalize on the subsequent market recovery in 2009.
This case study highlights the importance of paying attention to RSI divergence, especially in volatile markets. It also underscores the need for patience and discipline, as divergence signals can take time to play out fully.
Optimizing RSI for Personal Trading
Adapting RSI for Personal Trading Style
One of the strengths of the RSI is its versatility, allowing traders to adapt the indicator to suit their personal trading styles. For instance, aggressive traders who prefer short-term trades might use a shorter RSI period, such as 7 or 9 periods, to generate more frequent signals. This approach can be particularly effective in fast-moving markets where quick decision-making is essential.
Conversely, conservative traders who focus on long-term trends might use a longer RSI period, such as 21 or 30 periods, to reduce the number of signals and focus on the most significant price movements. By using a longer RSI period, these traders can filter out minor fluctuations and avoid overtrading, thereby reducing the risk of whipsaw losses.
Additionally, traders can customize the RSI’s overbought and oversold thresholds to better align with their risk tolerance and market conditions. For example, in a strong bull market, a trader might raise the overbought threshold to 80 and lower the oversold threshold to 20, allowing for greater flexibility in responding to extreme price movements.
Choosing the Right RSI Settings
Selecting the appropriate RSI settings is crucial for optimizing its effectiveness. The standard 14-period RSI is a good starting point for most traders, as it provides a balanced view of price momentum. However, depending on the asset being traded and the trader’s goals, adjustments to the RSI settings may be necessary.
For example, in highly volatile markets, such as cryptocurrencies, shortening the RSI period to 7 or 9 can make the indicator more responsive to rapid price changes. In contrast, for more stable assets, such as blue-chip stocks, a longer RSI period, like 21 or 30, may be more appropriate to capture broader market trends.
Traders should also consider their trading time frame when choosing RSI settings. Day traders and scalpers, who focus on minute-to-minute price movements, may benefit from shorter RSI periods, while swing traders and position traders, who hold positions for days or weeks, may prefer longer periods to avoid being whipsawed by short-term volatility.
Integrating RSI into a Broader Trading System
The RSI is most effective when used as part of a broader trading system that includes other technical indicators, risk management strategies, and fundamental analysis. For instance, a trader might use the RSI in conjunction with moving averages to confirm the direction of the trend and identify potential entry and exit points.
In addition to technical indicators, traders should also consider incorporating risk management strategies, such as setting stop-loss and take-profit levels, to protect their capital and maximize profits. By combining the RSI with other tools and strategies, traders can develop a more robust and reliable trading system that adapts to different market conditions.
Fundamental analysis can also play a role in enhancing RSI-based strategies. For example, a trader might use the RSI to identify potential buying opportunities in an oversold stock, but before entering the trade, they could analyze the company’s financial health, industry position, and growth prospects to ensure that the trade aligns with long-term investment goals.
The Future of RSI in Algorithmic Trading
RSI and Algorithmic Models
The integration of RSI into algorithmic trading models has become increasingly popular as technology advances and access to high-frequency trading systems becomes more widespread. Algorithms can be programmed to automatically execute trades based on RSI signals, reducing the impact of human emotion and improving execution speed.
In algorithmic models, the RSI can be combined with other indicators and customized settings to create complex trading strategies that adapt to changing market conditions. For example, an algorithm might be designed to enter long positions when the RSI crosses above 30 and exit when it crosses above 70, while also factoring in moving average crossovers and volume spikes to filter out false signals.
The automation of RSI-based strategies allows for continuous monitoring of multiple markets and assets simultaneously, enabling traders to capitalize on opportunities across different time zones and asset classes. As algorithmic trading continues to evolve, the RSI will likely remain a key component of these models, offering a reliable and flexible tool for identifying momentum shifts and trend reversals.
Using RSI in AI-Powered Trading Systems
Artificial intelligence (AI) is increasingly being integrated into trading systems, enhancing the ability to process vast amounts of data and identify patterns that may not be apparent through traditional technical analysis. The RSI, with its clear and quantifiable signals, is well-suited for incorporation into AI-powered trading systems.
AI algorithms can analyze historical RSI data alongside other indicators and market variables to identify patterns and correlations that can improve the accuracy of trading signals. For instance, an AI system might learn that certain RSI readings are more predictive of reversals in specific market conditions or when combined with other indicators like MACD or Bollinger Bands.
As AI technology advances, it is likely that RSI-based strategies will become more sophisticated, allowing for real-time adjustments based on market behavior and improving the overall effectiveness of trading systems. This integration of RSI into AI-powered systems could lead to more consistent trading performance and better risk management.
RSI’s Role in High-Frequency Trading
High-frequency trading (HFT) involves executing a large number of trades at extremely high speeds, often in milliseconds or microseconds. In this environment, the RSI’s ability to provide quick momentum signals can be invaluable. HFT algorithms can be programmed to take advantage of small price movements identified by the RSI, capturing profits in a matter of seconds.
However, the use of RSI in HFT requires careful consideration of the indicator’s settings and the overall strategy. In such fast-paced environments, even a slight delay in signal processing or execution can result in missed opportunities or losses. Therefore, RSI settings in HFT systems are often optimized for the shortest possible periods, ensuring that the indicator responds immediately to market changes.
As technology continues to evolve and HFT becomes even more advanced, the RSI will likely remain a key component of these systems, helping traders exploit small inefficiencies in the market and execute trades with precision.
FAQs
The Relative Strength Index (RSI) is a momentum oscillator developed by J. Welles Wilder Jr. in 1978. It measures the speed and change of price movements on a scale of 0 to 100. The RSI is widely used in technical analysis to identify overbought or oversold conditions in a market, helping traders anticipate potential reversals or corrections in price trends.
he RSI is calculated using the following steps:
Calculate the Average Gain and Average Loss over a specified period, typically 14 days.
Determine the Relative Strength (RS) by dividing the average gain by the average loss.
Calculate the RSI using the formula: RSI = 100 – [100 / (1 + RS)].This formula converts the relative strength into a number between 0 and 100.
RSI above 70: Indicates that the asset may be overbought, suggesting that it might be due for a price correction or reversal.
RSI below 30: Indicates that the asset may be oversold, suggesting that it might be due for a price rebound or upward movement.
RSI between 30 and 70: Generally considered neutral, with no strong overbought or oversold conditions.
While both RSI and MACD are momentum indicators, they measure different aspects of price movements:
RSI: Focuses on the speed and change of price movements, identifying overbought and oversold conditions.
MACD: Measures the relationship between two moving averages (typically the 12-day and 26-day EMAs) and provides signals based on crossovers and divergence from the signal line.
These indicators are often used together to provide a more comprehensive analysis of market conditions.
Yes, the RSI is a versatile indicator that can be applied to various asset classes, including stocks, forex, commodities, and cryptocurrencies. However, the settings and interpretation might need to be adjusted depending on the volatility and trading characteristics of the specific asset.
Traders typically use RSI to generate trading signals based on its position relative to overbought and oversold thresholds:
Buy Signal: When RSI crosses above 30, indicating that the asset may be recovering from an oversold condition.
Sell Signal: When RSI crosses below 70, indicating that the asset may be due for a correction after being overbought.
Some traders also look for RSI divergence (when the RSI and price move in opposite directions) as a signal for potential trend reversals.
The RSI is not infallible and has several limitations:
False Signals: Especially in trending markets, RSI can stay overbought or oversold for extended periods, leading to premature buy or sell decisions.
Lagging Indicator: RSI is based on past price movements, so it may not always accurately predict future trends, especially during sudden market events.
Not Standalone: RSI signals should be used in conjunction with other technical indicators and market analysis to improve reliability.
Traders can customize the RSI period (number of days used in the calculation) to better suit their trading style:
Shorter Period (e.g., 7 days): Provides more responsive signals, suitable for short-term traders looking to capitalize on quick price movements.
Longer Period (e.g., 21 days): Produces smoother, more stable signals, ideal for long-term traders focused on broader market trends.
Additionally, traders might adjust the overbought/oversold thresholds (e.g., 80/20) based on the asset’s volatility and market conditions.
Yes, combining RSI with other technical indicators can enhance its effectiveness. Common combinations include:
RSI and Moving Averages: Using moving averages to confirm trend direction alongside RSI to identify potential entry/exit points.
RSI and MACD: Pairing RSI’s momentum signals with MACD’s trend-following signals for more robust trading decisions.
RSI and Bollinger Bands: Utilizing Bollinger Bands to identify volatility and RSI to assess momentum within the context of price ranges.
RSI divergence occurs when the RSI indicator moves in the opposite direction of the price. There are two types:
Bullish Divergence: RSI forms higher lows while the price forms lower lows, indicating weakening bearish momentum and a potential upward reversal.
Bearish Divergence: RSI forms lower highs while the price forms higher highs, indicating weakening bullish momentum and a potential downward reversal.
Traders often use RSI divergence as a signal to anticipate trend reversals and adjust their trading positions accordingly.


Leave a Reply
Want to join the discussion?Feel free to contribute!